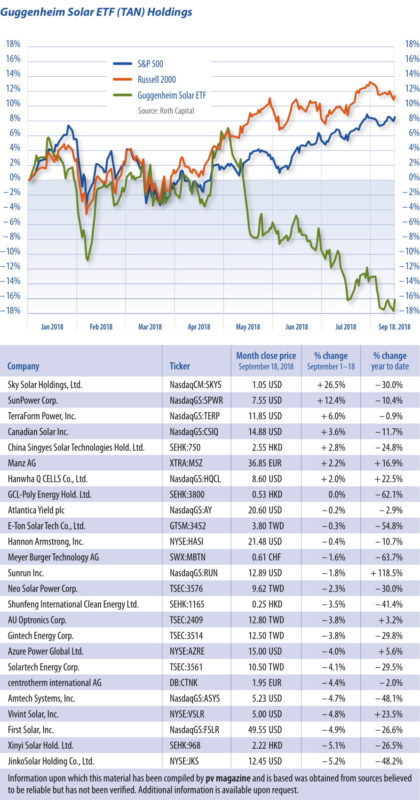
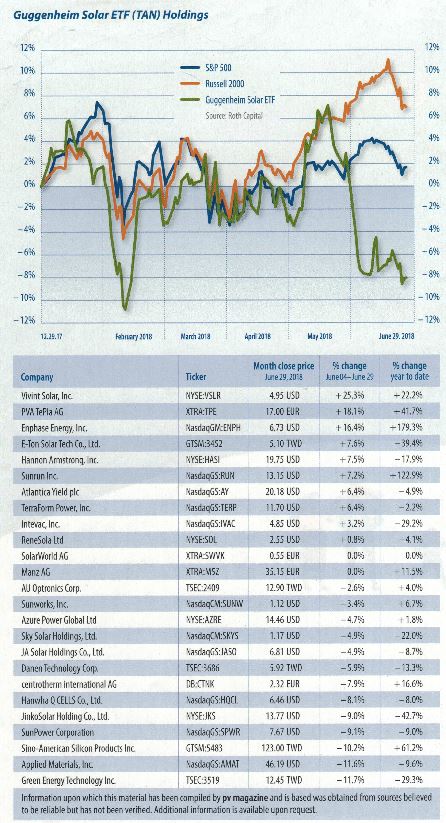
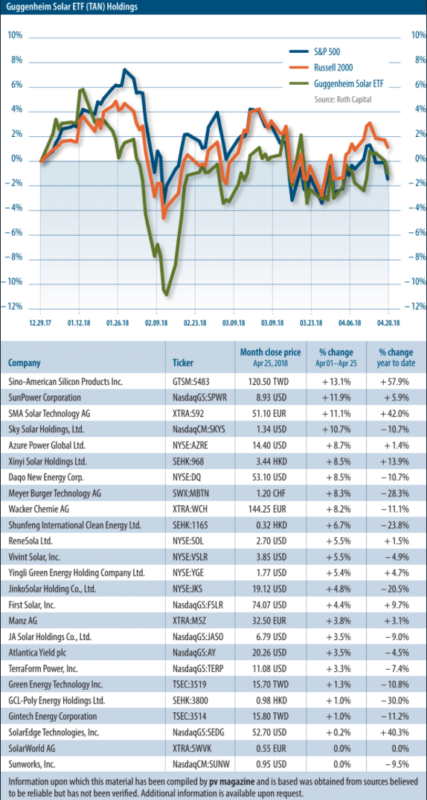
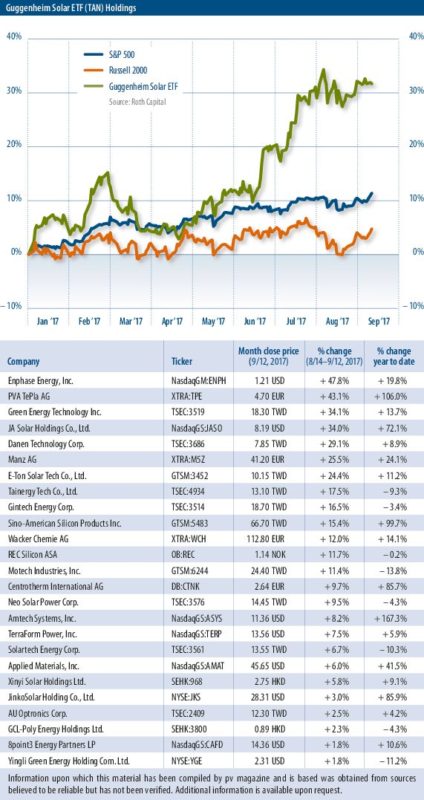
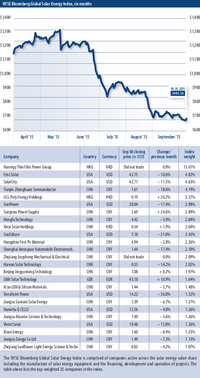
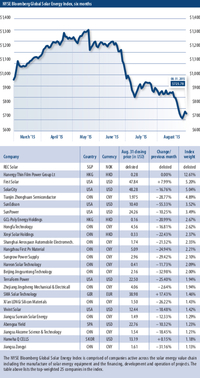
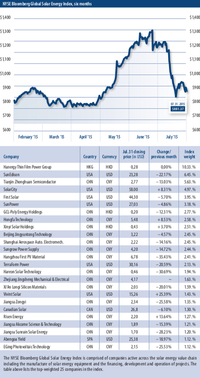
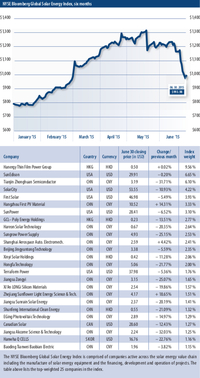
January 2021: More to come in ‘21
 With the wholesale transformation of the power industry from the inside out and other energy transition mega-trends, capital will continue to flow into renewables from ESG, energy funds, and retail, writes ROTH Capital Analyst Jesse Pichel. Look for a greater mix of unsubsidized economic solar projects to support improving revenue visibility, increasing earnings quality, and multiple expansions.
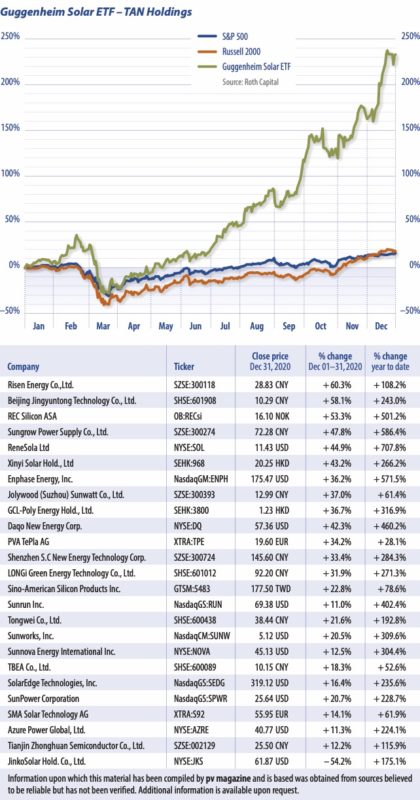
In December, the Guggenheim Solar ETF (TAN) increased 23.2% vs. the S&P 500 and the Dow, which both increased 2.6%. The TAN gained 233.6% vs. the S&P 500 and the Dow, which increased by 16.3% and 7.2% in 2020. The top five solar PV stock performers in the U.S. market for December were ReneSola (SOL), Daqo New Energy (DQ), Enphase Energy (ENPH), Canadian Solar (CSIQ), and SunPower (SPWR). They increased by 45%, 42%, 36%, 22% and 21%, respectively. The top five in 2020 were SOL, ENPH, DQ, Sunrun (RUN), Sunworks (SUNW), with gains of 708%, 572%, 460%, 402%, and 310%.
Global demand will remain strong in 2021. Roth Senior Analyst Phil Shen believes there will be 25-30% growth for U.S. residential PV in 2021, given the extension of the 26% ITC for another two years, increasing demand for backup power, and the potential easing of Covid-19 restrictions.
The ITC/PTC extension reduces a potential pull-in of demand in 2021, but supports higher medium-term growth. The extent of growth will be driven in part by how quickly constraints in the system – labor, BOS, inverters, and possibly even modules – can be relieved. Recent ABS issuances have priced in a range of ~2.3-3.2% compared with pre-Covid levels of ~3.5-4.0%. The reduction in rates was due in large part to a decline in base rates, though solar ABS issuances provide some evidence of spread compression.
The industry continues to forecast a glass supply gap of 8-10 GW in 2021, with large-sized glass capacity expected to satisfy only 50-60% of total demand. Prices for polysilicon have bottomed-out and rebounded, increasing ~1% WoW, signaling the end to three consecutive months of slow but steady declines. Driven by planned expansions in wafer capacity, Tier-1 players including Longi, Trina, and Jinko have locked in up to 812k MT of polysilicon supply over the next several years, in anticipation that supply stays largely unchanged up to 2022.
Jesse Pichel
December 2020: The Biden effect
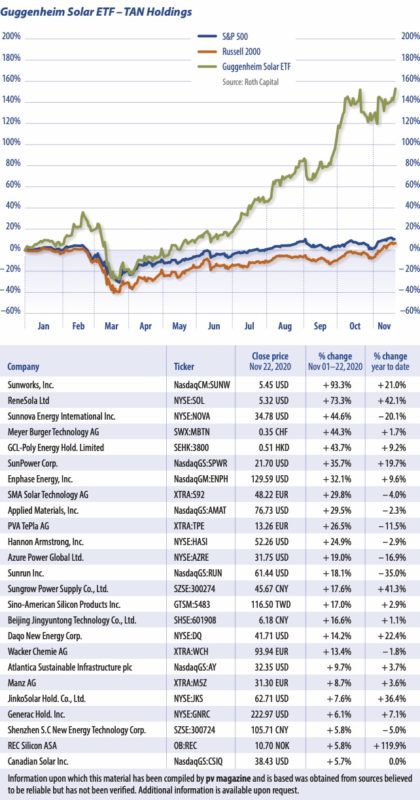 Solar stocks continued to outperform the broader market in November, writes Jesse Pichel of ROTH Capital Partners. Tailwinds from the election results drove positive sentiment in the United States, while the end of the exemption from Section 201 tariffs for bifacial products could be bad news for module imports.
In November, the Guggenheim Solar ETF (TAN) increased 13.5% vs. the S&P 500 and Dow, which increased by 8.8% and 10.4 %, respectively. Year to date, the TAN gained 153.3% vs. the S&P 500 and the Dow, which increased 10.1% and 2.5% respectively.
The top five solar stock performers in the U.S. market for November were Sunworks (SUNW), ReneSola (SOL), Sunnova Energy (NOVA), SunPower (SPWR), and Enphase Energy (ENPH). They increased 93%, 73%, 45%, 36% and 32%, respectively. The main driver for the surge is the Joe Biden tailwind, as investors bet on a clean energy revolution, much higher solar penetration, and an ITC extension in the near term.
Residential outlook
In the past earnings season, residential solar stocks – including SPWR, NOVA and Sunrun (RUN) – reported a healthy quarter and strong guidance. ENPH also delivered a third-quarter beat as well as faster-than-expected energy storage growth in both the United States and Europe. Roth Research Analyst Phil Shen expects the U.S. residential market to have greater growth of 25-30% in 2021.
As the bifacial exclusion on the Section 201 tariff has been removed, the bifacial panels that were previously coming into the United States free of Section 201 tariffs will now be subject to the current 20% rate. This could be an incremental positive for companies like First Solar (FSLR) but an incremental negative for JinkoSolar (JKS) and Canadian Solar (CSIQ), as the U.S. is a source of meaningful margin contribution.
The market is also paying close attention to the Xinjiang Uighur risk for the solar supply chain. There are a couple of paths that could lead to a ban on solar imports with suspected links to forced labor in Xinjiang, and solar module manufacturers are already taking action to rearrange their supply chains to avoid Xinjiang exposure.
Author: Jesse Pichel, Roth Capitcal Partners
November: 2020: Riding strong residential growth
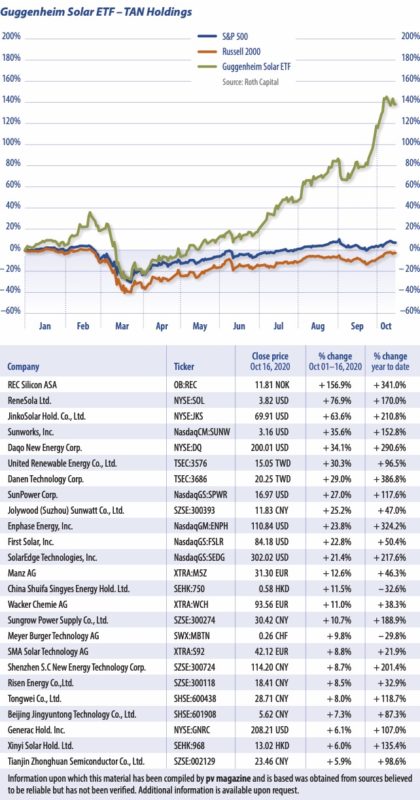 Solar stocks have seen significant upside in October, writes ROTH Capital Partners’ Jesse Pichel. The Guggenheim Solar ETF (TAN) increased 9.4% vs. the S&P 500 and the Dow, which increased by 3.0% and 2.8%, respectively. Year to date, the TAN gained 139% vs. the S&P 500 and the Dow, which rose 7.8% and fell 0.2%, respectively.
The top five solar stock performers in the U.S. market for October were ReneSola (SOL), JinkoSolar (JKS), Sunworks (SUNW), Daqo (DQ), and SunPower (SPWR). They increased 77%, 64%, 36%, 34% and 27%, respectively. The market sees positivity in China’s 14th Five-Year Plan and potential for 60 GW to more than 80 GW per year of demand. There is also a high probability of Joe Biden being elected in November and with it an ITC extension that could support solar, including standardized national permitting.
ROTH recently hosted the eighth U.S. residential solar webinar and a few takeaways include: (1) Originations were unaffected by the wildfires and hurricanes, and showed significant (more than 50%) YoY growth in Q3; (2) Inverter share mix between SolarEdge and Enphase continues to appear stable, with GNRC continuing to chip away with its storage product; and (3) Storage is growing meaningfully with solar installations on an absolute basis, but attach rates appear to be relatively flat on a nationwide basis.
ROTH Analyst Phil Shen reiterates his view for U.S. residential solar installations to be up more than 10% YoY in 2020. He sees growth in parts of the second half accelerating to 15-20% YoY levels and is incrementally more positive on the outlook for growth beyond 2020. While U.S. residential solar sales have returned in a strong way, the backlog appears to be growing. With Covid-19 infections rising, constraints are hitting, with the work of installation crews being impacted.
Early this month, Sunrun (RUN) completed the acquisition of Vivint Solar. The two companies now serve about 500,000 customers, with the capacity to supply more than 3 GW of solar PV energy. Another big movement in solar universe was Array Technologies’ (ARRY) IPO. The New Mexico-based ground-mounted system manufacturer went public for a total offering of more than $1 billion. We will now remove Vivint Solar and add ARRY in our stock tracker.
Author: Jesse Pichel, Roth Capital Partners
October 2020: Will China double down
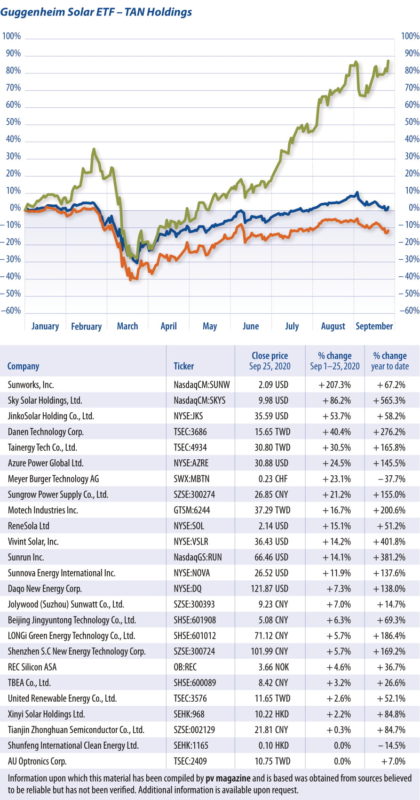
Solar stocks outperformed the broader market in September. In September, the Guggenheim Solar ETF (TAN) increased 0.2% vs. the S&P 500 and Dow, which decreased by 6.5% and 5.1%, respectively. Year to date, the TAN gained 87% vs. the S&P 500 and Dow, which rose 2.1% and decreased 4.8%.
The top five solar stock performers in the United States market for the month of September were Sunworks (SUNW), Sky Solar (SKYS), JinkoSolar (JKS), Azure Power (AZRE), and ReneSola (SOL), which increased 207%, 86%, 54%, 25%, and 15%.
According to PV InfoLink, despite the lack of specific targets or subsidies for renewables so far, China’s 14th Five Year Plan is expected to drive yearly solar installations of around 45 GW. PV Infolink expects the proportion of renewables in China’s energy mix to increase from 15.3% as of year-end 2019 to a targeted 18-20% during the Five Year Plan’s lifetime, with the majority of the increase to come from China doubling down on solar and wind.
China is currently soliciting comments on a draft of the upcoming plan, with this consultation period set to end in November. The official draft will likely be submitted in March 2021, with a final announcement of the new plan and relevant policies in the second half of next year.
Supply chain
In terms of the supply chain, as of Sept. 23, multicrystalline-grade polysilicon was at $9.84/kg, flat week on week (WoW). Monocrystalline grade poly was at $13.80/kg, flat WoW, while multi wafers were at $0.05/W, flat WoW. Mono wafers were at $0.07/W, flat WoW, while multi modules were at $0.17/W, flat WoW. Mono modules were at $0.20/W, down 1.3% WoW.
As the public listed companies will be reporting earnings for the previous quarter in the coming weeks, we will update readers in the next issue on their latest financial situations.
Author: Jesse Pichel, ROTH Capital Partners
September 2020: Stocks rally on storage demand
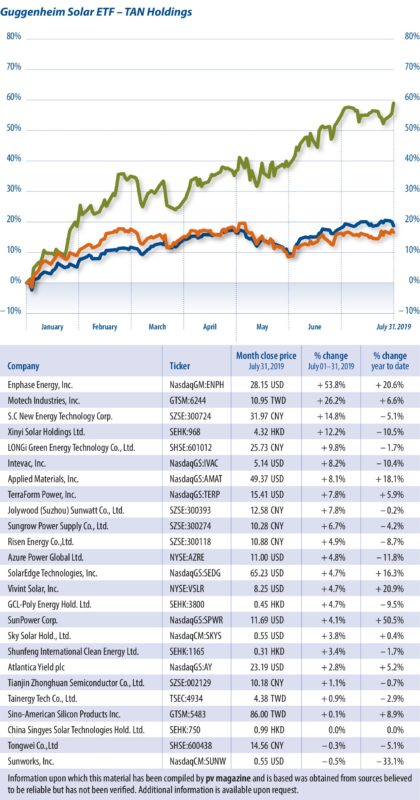
With power outages in two U.S. states this month, many are looking to storage solutions to ensure reliable power supply. This, writes Jesse Pichel of Roth Capital Partners, could prove a short-term driver for storage stocks.
Solar stocks outperformed the broader market in August. In August, the Guggenheim Solar ETF (TAN) increased 15% vs. the S&P 500 and Dow, which increased 3.1% and 5.7%, respectively. YTD, the TAN gained 67% vs. the S&P 500 and Dow that increased 4.4% and decreased 2.1%. The top five solar stock performers in the U.S. market for August were SolarEdge (SEDG), First Solar (FSLR), Sunrun (RUN), Vivint Solar (VSLR), and SunPower (SPWR). They increased 25%, 25%, 24%, 23% and 22%, respectively.
The power outage in New Jersey and another season of wildfires and associated rolling blackouts this month in California are reminding many of the need for more stable power supplies, while driving new demand for energy storage.
Based on our channel check, some companies’ storage product lead times may now be the end of November, if orders are placed now. This could be a catalyst for storage-related stocks in the short term. As major solar companies are still reporting their earnings this month, we will have a greater update for you in the next issue.
In other news, we learned this week that GCL Xinjiang may be targeting a resumption of production sooner than expected. PV InfoLink believes the company may have a little bit of product as early as September. SSX also believes this may be the case, but expects polysilicon pricing to remain strong in October as volumes for resumed production are likely going to be low to start.
In terms of the supply chain, as of Aug. 12, multicrystalline grade polysilicon was at $8.79/kg, up 1.7% WoW; mono grade poly was at $12.39/kg, up 3.6% WoW; multi wafer was at $0.05/W, up 3.2% WoW; multi module was at $0.17/W, flat WoW; and mono module was at $0.19/W, up 1.4% WoW.
Jesse Pichel, ROTH Capital Partners
August 2020: Signs of a strong second half
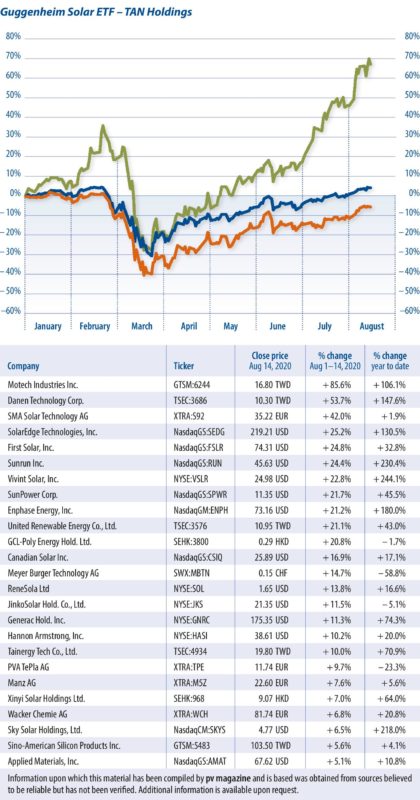
Solar stocks enjoyed another good month in July, writes ROTH Capital Partners Jesse Pichel. A major acquisition deal is driving investor confidence in the United States, new wafer capacity is coming online, and the temporary loss of some polysilicon manufacturing capacity is pushing prices up slightly.
Solar stocks outperformed the broader market in July. The Guggenheim Solar ETF (TAN) increased 27% vs. the S&P 500 and the Dow, which increased 4.9% and 3.4%, respectively. Year to date, the TAN gained 48% vs. the S&P 500, which increased 0.7%, and the Dow, which fell 6.5%. The top five solar stock performers in the U.S. market for July were Vivint Solar (VSLR), Sunrun (RUN), Sunworks (SUNW), Daqo New Energy (DQ), and SunPower (SPWR). They increased 112%, 95%, 52%, 50% and 35%, respectively.
One key driver for solar stocks this month was Sunrun’s acquisition of Vivint Solar. Another factor was the increase in polysilicon prices due to new wafer capacity coming online, although some polysilicon capacity did go offline in China.
On July 6, Sunrun announced a definitive agreement to acquire Vivint Solar for an enterprise value of $3.2 billion (based on July 6 closing prices) in an all-stock transaction. Both stocks rallied on the announcement, with VSLR up 38% and RUN up 23%. The rally indicated investor confidence in the cost advantages of scale driving growth and profitability, and also a healthy to strong second-half recovery in the U.S. residential solar market.
As for the supply chain, polysilicon prices continue to recover. According to China Silicon Industry, prices rose 2.2% week on week as new wafer capacity continues to come online and more than 10,000 MT of polysilicon capacity in China and abroad undergoes maintenance.
Additionally, there were reports on July 20 that multiple flash explosions took place at a large GCL polysilicon facility, taking an estimated 50 MT of production capacity offline, or around 10% of global production. With the GCL polysilicon facility taking 10% of global poly production offline, we see pricing moving higher until the capacity resumes production. ROTH research increased its poly average selling price forecast 5% for Q3 2020 to $8.20/kg from $7.45/kg, 13% for Q4 2020 to $8.80/kg from $7.80/kg, and 5% for Q1 2021 to $8.40/kg from $8.00/kg.
Jesse Pichel, ROTH Capital Partners
July 2020: V for recovery
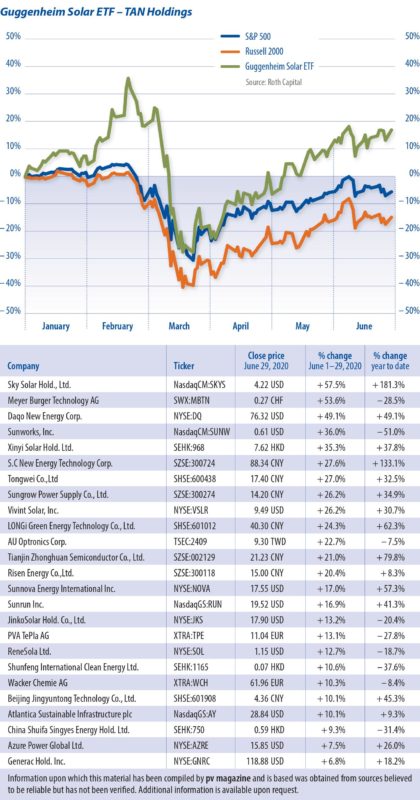 In June, the Guggenheim Solar ETF (TAN) increased 6.7% vs. the S&P 500 and Dow increased 0.3% and 0.8%, respectively. Year to date (YTD), the TAN gained 17% vs. the S&P 500 and Dow, which fell 5.5% and 10.3%. Top five solar stock performers in the U.S. for June were Sky Solar (SKYS), Daqo New Energy (DQ), Sunworks (SUNW), Vivint Solar (VSLR), and Sunnova (NOVA). They increased 58%, 49%, 36%, 26% and 17%, respectively.
Earlier this month, we hosted our fifth U.S. residential solar webinar. Results from the SolarWakeup survey showed sales down in May year on year, but flat vs. Feb 2020. Survey participants expect 2020 U.S. residential sales to be flat or slightly down (16% expecting improvement, 35% expecting flat, and 47% expecting decline) and our webinar participants suggested they are seeing a “V-shaped” recovery, with Q2 representing a YoY dip, but Q1, Q3, and Q4 expected to show YoY gains.
As for the solar supply chain, new production capacity for wafers in China has gradually come online, stimulating demand for polysilicon. At the same time, maintenance for a number of larger polysilicon producers is still underway. Despite the growing impetus from polysilicon producers to raise prices, they have still held steady in the last week of June.
Downstream wafer companies are facing mounting risk for further price reductions as capacity continues to expand, and are unwilling to support higher prices upstream. This is expected to change soon, with a number of polysilicon producers already beginning to quote slightly higher prices.
As of June 24, multi-grade polysilicon was $4.10/kg, flat WoW, down 43% YTD; mono grade polysilicon was $8.33/kg, flat WoW, down 19% YTD; multi wafer at $0.04/W, flat WoW, down 28% YTD; multi cell at $0.06/W, flat WoW, down 15% YTD; multi module at $0.17/W, down 0.8% WoW, down 13% YTD; and mono PERC module at $0.20/W, down 0.7% WoW, down 13% YTD.
Jesse Pichel, ROTH Capital Partners
June 2020: Ahead of the curve
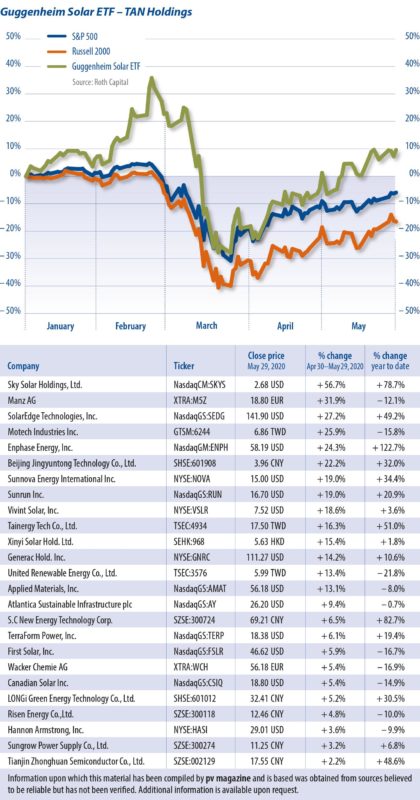 In May 2020, the Guggenheim Solar ETF (TAN) increased by 12%, versus the S&P 500 and the Dow that increased 4.5% and 4.3% respectively. Year to date, the TAN has gained 9.6% vs. the S&P 500 and Dow that decreased 5.8% and 11% respectively.
The top five solar stock performers in the United States market for May were Sky Solar (SKYS), SolarEdge (SEDG), Enphase (ENPH), Sunnova (NOVA), and Sunrun (RUN) that increased 57%, 27%, 24%, 19% and 19%, respectively. The strength in residential power electronics suppliers SolarEdge and Enphase, as well as rooftop solar specialists Sunnova and Sunrun, indicates strong expectations among investors for the U.S. residential market.
Our recent checks suggest that U.S. residential volumes through the month of May 2020 might have accelerated substantially, and that we could see a strong third quarter on the way.
Also our recent U.S. residential solar webinar panel, hosted by research analyst Phil Shen indicated that 2021 could be a “monster” year with strong growth in this market.
Supply chain
As for the PV supply chain, pricing throughout the solar ecosystem continues to be quite challenged, despite the demand rush in China ahead of the June 30 installation deadlines. Although demand excluding China may be picking up as expected, the overall environment remains weak.
As of May 27, multi-grade poly was at $4.23/kg, flat WoW, down 41% YTD; mono grade poly was at $8.31/kg, flat WoW, down 19% YTD; multi wafer at $0.04/W, flat WoW, down 26% YTD; multi cell at $0.06/W, flat WoW, down 15% YTD; multi module at $0.18/W, down 1.5% WoW, down 10% YTD; and mono module PERC at $0.20/W, down 1.3% WoW, down 9.3% YTD.
Jesse Pichel, ROTH Capital Partners
May 2020: Looking past the pandemic
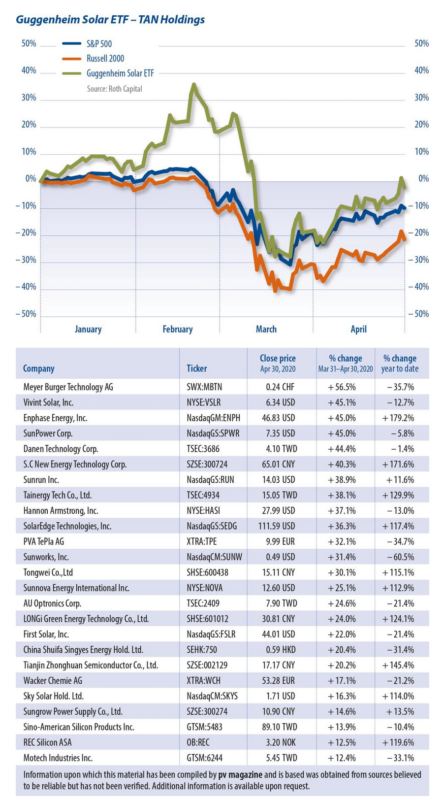
Solar stocks rebounded and outperformed the broader market in April. The Guggenheim Solar ETF (TAN) increased 19% vs. the S&P 500 and Dow, which increased by 13% and 11%, respectively. Year to date, the TAN declined 2.2% vs. the S&P 500 and Dow, which decreased 9.9% and 14.7%, respectively.
The top five solar stock performers in the United States for April were Vivint Solar (VSLR), Enphase (ENPH), SunPower (SPWR), Sunrun (RUN), and Hannon Armstrong (HASI), which increased by 45%, 45%, 45%, 39% and 37%, respectively.
As highlighted last month, the worldwide outbreak of Covid-19 has caused panic across global markets and investors remain cautious. From a supply chain perspective, module prices have continued to fall and polysilicon has dropped below cost.
As of April 29, multicrystalline-grade polysilicon stood at $5.37/kg, flat week-on-week. Monocrystalline grade polysilicon settled at $8.76/kg, down 1.6%, while multi wafers reached $0.04/W, down 4%. Mono wafers settled at $0.07/W, flat, while multi cells reached $0.07/W, down 1.1%. Mono PERC cells reached $0.10/W, up 1.3% for the week, while multi modules reached $0.19/W, down 0.7%. Mono PERC modules, meanwhile, settled at $0.21/W, down 0.7%.
It’s now time to think ahead once again. While we are still fighting the global Covid-19 pandemic, recent market strength indicates investors’ expectations that the economy will begin to reopen in the coming months.
On April 24, solar research analyst Phil Shen hosted a first-quarter 2020 earnings preview webinar, and highlighted some key solar themes observed during and after the pandemic: 1) Oversupplied upstream industry leads to lower pricing; 2) Utility-scale costs are 10-20% higher; and 3) Lower cost of installations and capital for U.S. residential post-Covid-19.
Jesse Pichel, ROTH Capital Partners
April 2020: Covid-19 and oil supply shock
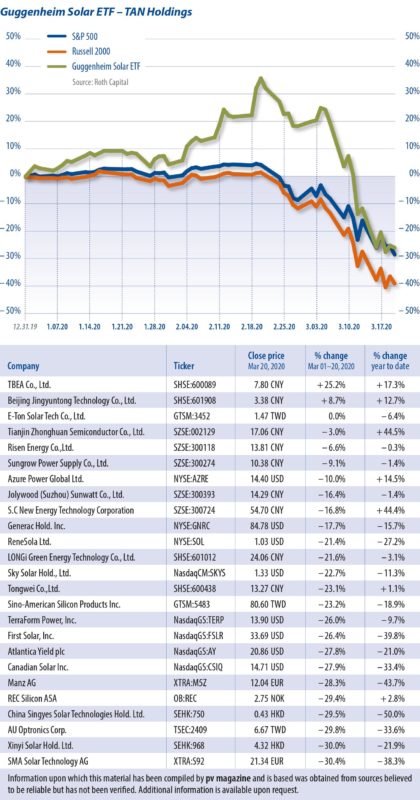
In the last edition, we were concerned about the looming outbreak of Covid-19, but we never imagined it would decapitate global economies, while the Saudis devastated the U.S. fossil fuels industry.
As we write this note, U.S. Congress is voting on a $2 trillion virus aid package that may include the extension of the ITC and other carbon-reduction measures.
In March, the S&P 500 and Dow dropped significantly, by 22.0% and 24.5%, respectively. The Guggenheim Solar ETF (TAN) decreased 37.6% and the U.S. solar market saw the most impact in the residential sector, where Vivint (VSLR), Sunrun (RUN), Sunworks (SUNW), Enphase (ENPH), and SolarEdge (SEDG) fell 64%, 56%, 47%, 44%, and 44%.
Investors fear that Covid-19 will slow solar projects due to a “domino effect” of delays through the supply chain, an inability to install or finance, and a general lack of demand. For U.S. residential, there is a 30% cancellation or postponement of bookings and the sales funnel is likely to halt. The shape of the recovery (in Q3, Q4, or 2021) will very much depend on the U.S. government stimulus and that of the global economies.
An ITC extension may be included in the coronavirus package. According to ROTH Capital Analyst Phil Shen, it’s likely that the ITC extension would not be included in the Phase 3 rescue package expected to be passed shortly after the time of writing, but it appears it could now be in the House bill. If not, then it could be in the Phase 4 bill to be passed in the coming weeks. The extension could be as much as three years and could also take the form of a Section 1603 Treasury grant. We would view an ITC extender as a longer-term positive for PV, and not a near-term cure to the economic impact of the virus.
ROTH held a virtual conference and hosted 12 renewable energy companies including ENPH, NOVA, RUN, VSLR, GNRC (NC), SPWR, TPIC, Nordex (XTRA: NDX1 – NC), REC Silicon (OSE: REC – NC), AZRE, SUNW, Sunlight Financial (Private). Companies had not yet seen demand destruction from Covid-19, but clearly anticipated it. As the impact is shifting from Asia to Western countries, we are seeing a potential oversupply situation brewing as China’s supply chain ramps up post-coronavirus, while global PV demand deteriorates. Stimulus in China may somewhat offset the global oversupply.
Jesse Pichel, ROTH Capital Partners
March 2020:‘Sector rotation has begun’
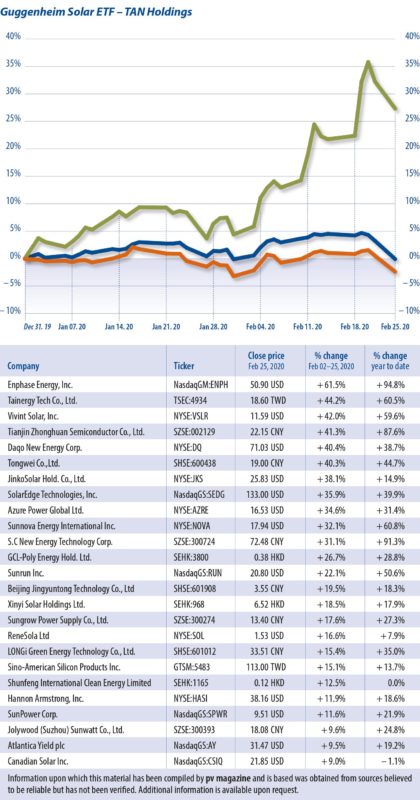
In February, the Guggenheim Solar ETF (TAN) increased 17.6% versus the S&P 500 and Dow, which increased 0.4% and decreased 0.6%, respectively. The top five solar stock performers in the U.S. market were Enphase (ENPH), Vivint (VSLR), Daqo (DQ), JinkoSolar (JKS), and SolarEdge (SEDG), with respective increases of 62%, 42%, 40%, 38%, and 36%. We believe strong performance was due to sector rotation into environmental social and corporate governance (ESG) out of oil and gas, and a strong U.S. solar residential market.
As we highlighted in our December 2019 report, we see growing interest from the investor community in ESG, where solar plays a critical role. In BlackRock’s 2020 client letter, CEO Larry Fink announced that sustainability was its “new standard” for investing. Also earlier, Microsoft CEO Satya Nadella revealed plans to be carbon negative by 2030. We believe that the sector rotation has begun. We not only see investors moving away from oil and gas to sustainability, but also observe new funds established for ESG only. Tesla (TSLA)’s stock is one example of this. The stock has gained 86% year to date and is trading on analysts’ 2024 forecasts for $32 EPS, or 25x P/E. As ESG becomes the main investment theme of 2020, we speculate that long-term investors may also look toward midterm earnings in 2023-24.
Coronavirus panic
On the bear side, the worldwide outbreak of coronavirus (Covid-19) has caused panic across global markets. As of Feb. 25, China had more than 77,000 confirmed cases. South Korea, Japan, and Italy had reported 977, 862, and 323 cases. The S&P 500 fell more than 6% from last week’s closing and South Korea stocks dropped nearly 4%. With cities being locked down and travel discouraged, the global economy will slow down sharply in the first quarter and throughout 2020, depending on the virus. As we are still in the early stages of a global outbreak, investors remain cautious about the market.
Jesse Pichel, ROTH Capital Partners
February 2020: And they're off
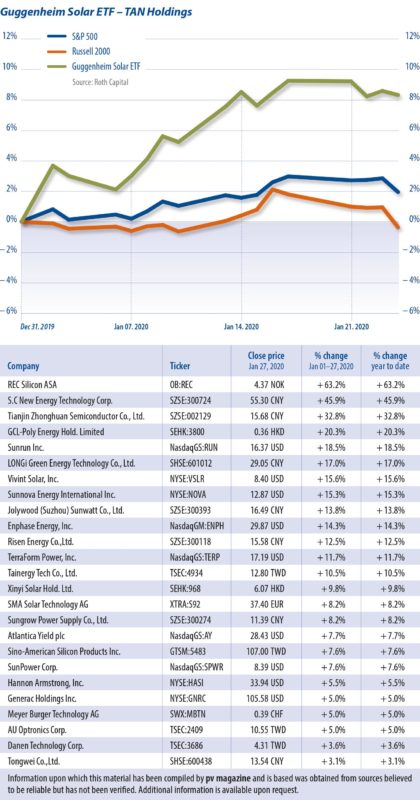
The strong performance of Sunrun, Vivint, and Sunnova dovetails with positive investor sentiment around the U.S. residential solar sector. Roth Capital analyst Phil Shen forecasts 25% year-on-year growth in the U.S. residential PV market this year.
There are two unfolding macro events for investors that could impact the solar industry: 1) U.S.-China trade; and 2) the coronavirus virus outbreak in China.
On Jan. 15, President Trump and Chinese Vice Premier Liu He signed a deal that cut some U.S. tariffs on Chinese goods in exchange for a Chinese pledge to purchase more American farm products, as well as energy and manufactured goods. China will also address some U.S. complaints about intellectual property. With the Phase 1 U.S.-China trade deal, negotiators have secured a Chinese commitment to purchase U.S.-produced polysilicon – U.S. polysilicon manufacturers have been locked out of the Chinese market since 2014.
As a result, REC Silicon stock gained 65% in one day. In an act of defiance, China’s Ministry of Commerce reinstated countervailing duties against U.S. polysilicon for an additional five years. Our checks indicate that this should not impact the Phase 1 deal, but the exact quantity of U.S. polysilicon remains unknown.
The coronavirus outbreak in China has concerned the global investor community. U.S., Japanese, and German stock markets declined 1.5%, 2.0%, and 2.8% on 1/27. China’s economy will slow significantly in Q1 and even throughout 2020, depending on the development of the outbreak. As China represents most of the supply and demand in the PV industry, the effect of the outbreak on solar can’t be understated at this stage.
Roth is hosting a Booth Tour at the 2020 Intersolar North America conference. The tour will include meetings with management teams of public and private companies spanning the solar ecosystem, including module vendors, BOS/ inverter suppliers, distributors; and industry experts. Soon after, Roth will host 16 companies at its annual OC Conference.
Jesse Pichel, ROTH Capital Partners
January 2020: New markets, renewed strength
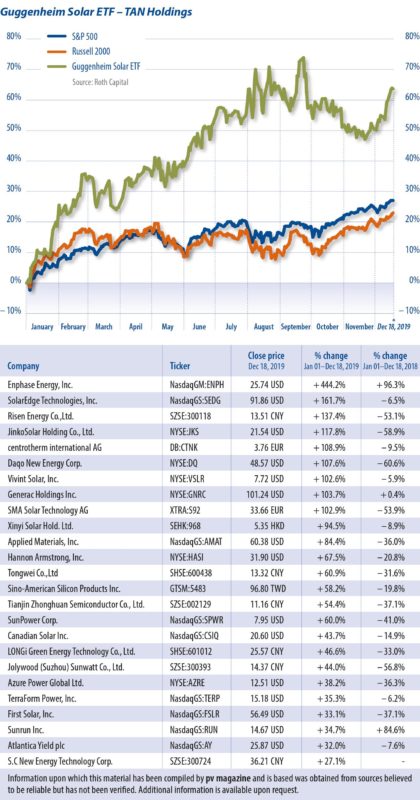 It has been an exciting year for solar stocks. The Guggenheim Solar ETF (TAN) increased by 64% versus the S&P 500 and Dow, which gained 27% and 21%, respectively. The top-performing sectors were the inverter and module/cell segments, which grew by 168% and 78%, respectively.
The top five stocks in the U.S. market were Enphase, SolarEdge, Jinko, Daqo, and Vivint Solar, gaining 444%, 162%, 118%, 108%, and 103%, respectively. In Europe, the top performers were centrotherm and SMA at 109% and 103%. Solar stocks were driven by several themes this year. One was China’s demand destruction, and its surprising replacement by new markets and renewed strength from existing ones. Supply and demand were more balanced, and the average selling price decline moderated versus 2018. Strong U.S. residential solar demand and the unfolding U.S.-China trade war were also key developments. And solar stocks are high beta stocks and generally outperform when the overall market is strong.
The major impact of the subsidy cut in China has been the collapse of upstream pricing and the decline of PV demand from 53 GW in 2017 to 44 GW in 2018 and 23 GW in 2019. Multi-grade and mono-grade poly are at $7.5 and $10.4/kg, down 29% and 11% YTD. Multi and mono wafers are at $0.05 and $0.09/W, down 17% and flat. Multi and mono PERC cells are at $0.08 and $0.12/W, down 30% and 26%, while multi and mono PERC modules are at $0.21 and $0.23/W, down 3.6% and 12%. The rate of ASP decline in 2019 was less than half the +40% ASP decline in 2018. According to ROTH Capital Partners, PV installations in EMEA and America rose 85% and 39% YoY in 2019. The U.S. residential market remains strong. ROTH continues to see +25% growth in this market for 2019 and 2020. Sunnova raised $170 million in the first U.S. solar IPO in years, Vivint and Sunrun gained 103% and 35% YTD. The strength in the U.S., combined with Huawei’s exit from the inverter market, drove Enphase and SolarEdge’s shares stocks up 444% and 162% YTD. For 2020, we believe resi- and storage will be the two main themes. We see interest from investors in ESG, where solar plays a critical role and investor sentiment will remain impacted by the U.S.-China trade war.
Jesse Pichel, ROTH Capital Partners
December 2019: November blues
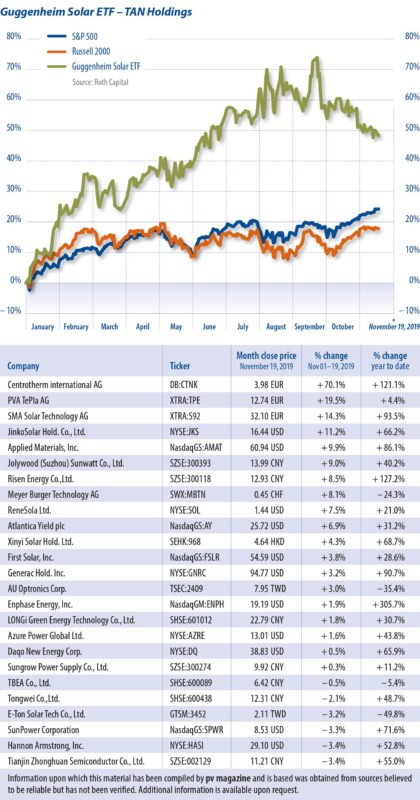 Solar stocks underperformed the broader market in November. The Guggenheim Solar ETF (TAN) decreased 1.4% vs. the S&P 500 and Dow, which increased 1.8% and 2.1%, respectively.
The Top five solar stock performers in the U.S. market were JinkoSolar (JKS), Applied Materials (AMAT), ReneSola (SOL), Atlantica Yield (AY), and First Solar (FSLR), which increased by 11%, 10%, 7.5%, 7%, and 4%, respectively. Sunworks (SUNW) went down 34% after delivering a Q3 loss and weak Q4 guidance, while Canadian Solar (CSIQ) fell 13.6% with a miss on Q3 revenue and earnings.
Key takeaways
Residential solar demand in the United States remains strong, with expected +25% year-on-year growth for 2019 and for 2020. However, labor issues and module supply will be the two biggest constraints with the strong demand ahead.
As the residential solar market shifts to new homes, ROTH Capital Partners analyst Phil Shen believes it will help solar leasing firms, since more than 90% of California’s new construction will be lease-financed.
The outlook for China remains weak. Shen has cut his 2020 China forecast to 29 GW (from 50 GW) and global demand forecast to 116 GW (from 137 GW), indicating that this weakness will likely continue for a few quarters, until lower module pricing results in demand creation in the rest of the world.
There are some updates on relevant policies. In the United States, for example, the Section 201 tariff exemption for bifacial products repeal is now halted, as Invenergy filed a complaint with backing from the Solar Energy Industries Association (SEIA). Abby Hopper and SEIA issued a release indicating that the solar investment tax credit (ITC) could be extended by five years. It would appear that investors believe that an ITC extension is not yet priced into stocks and would be a meaningful positive for the industry. Storage and wind are also expected to benefit from possible tax credit extensions.
According to Ne21.com (Century New Energy Network), China’s renewable energy subsidy will probably be canceled before 2021.
Jesse Pichel, Roth Capital Partners
November 2019: How long?
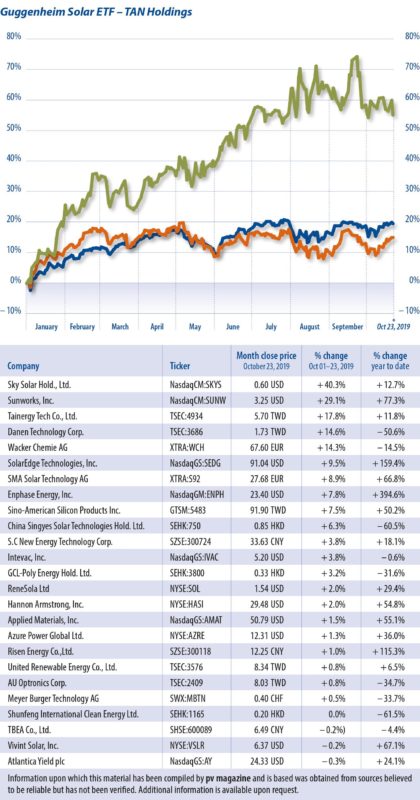
Solar stocks underperformed the broader market in October. The Guggenheim Solar ETF (TAN) rose 0.2% versus the S&P 500 and the Dow Jones industrial average, which increased 1.9% and 0.7%, respectively.
The top four solar stock performers in the U.S. market were Sky Solar (SKYS), Sunworks (SUNW), SolarEdge (SEDG) and Enphase Energy (ENPH), which increased by 40%, 29%, 9.5% and 8%, respectively.
Solar stocks have not performed very well since last month, which might be driven by China: 1) a negative outlook for China demand in 2020; 2) a new coal benchmarking pricing mechanism and lower coal prices; and 3) the ongoing uncertainty of the U.S.-China trade war. ROTH Capital Partners analyst Phil Shen has indicated that this negative sentiment could last for six to nine months, and will depend on how long China’s demand weakness lasts, and on how long it takes for unsubsidized, economic demand to grow. We believe the PV market is transitioning to a greater global mix of unsubsidized demand, where revenue visibility will improve, earnings quality will increase, and multiples will expand.
Post-SPI, we believe U.S. residential solar will grow much faster than expected (+25% YoY this year and next year versus consensus of mid-teens YoY growth). Resi stocks were up 8.2% in October and 62.5% year to date. We see more growth for residential backup power after recent intentional blackouts in California’s PG&E territory. The trend of ratepayers becoming disgruntled with their utility will benefit the U.S. residential sector.
China module pricing continues to decline and does not look set to recover in the fourth quarter, however mono polysilicon pricing is expected to increase in November, while multi is expected to have limited upside. Average module auction price in September was RMB 1.86/W ($0.26/W). In a 1.1 GW October auction, the lowest price for mono PERC 370W+ was RMB 1.74/W, while the average price was around RMB 1.80/W. China domestic mono grade polysilicon is now at $10.6/kg – flat compared to September.
We’re adding Generac to our PV tracking, given its recent entry into the sector, and removing Intevac, given its exit.
Jesse Pichel, ROTH Capital Partners
October 2019: Solar stocks sink after SPI
 What happened in Salt Lake, didn’t stay in Salt Lake, as solar stocks underperformed the broader market in September. The Guggenheim Solar ETF (TAN) decreased 3.9% vs. the S&P 500 and Dow, which gained 1.7% and 1.9%, respectively.
Solar Power International was well attended by hundreds of investor groups. The TAN was flat during SPI 2017 and down 3% during SPI 2018, while it decreased more than 6% during this year’s event, wiping out gains from the first half of September.
Several factors are responsible for stock declines during and after SPI, including a weaker outlook for China in the first half of 2020 and a potential price decrease for coal power. ENPH and to a lesser extent, SEDG, are seeing profit take sharp returns year-to-date and potential new entrants such as Generac could create competition. The weaker U.S. economic outlook and a broader sell-off of growth stocks looms, and investors want to lock in profits before 2020. Stocks with big gains saw the largest declines.
But it’s not all bad news. Roth Capital Partners hosted 16 companies at its seventh investor symposium at SPI and conducted investor booth tours with a range of distributors, developers, inverter companies, industry experts and private module manufacturers. Major takeaways include:
- U.S. residential fundamentals are strong and growing faster than the industry in 2018. with experts expecting 30-50% YoY growth through 2020.
- Our keynote speaker, John Marciano – partner and co-head of global project finance at Akin Gump – pegs a 60% probability for an ITC extension, with timing next year before the elections as opposed to by year-end 2019.
- Although the inverter space has become more competitive, with new offers from Generac, Delta, Tigo and others, Roth analyst Phil Shen does not see much near-term pressure on ENPH and SEDG, given healthy fundamentals.
- Panels selling at $0.25 or below abroad are over $0.40 in the United States, but much of the tariff-free capacity is sold to big utilities.
- PV InfoLink expects Chinese demand to decrease to 32 GW from previous expectations of 35 GW. It expects 2020 demand to reach 38.5 GW.
Jesse Pichel, Roth Capital Partners
September 2019: Trade war shadows all but solar

Graph: pv magazine/ Roth Capital Partners
Solar stocks outperformed the broader market in August. The Guggenheim Solar ETF (TAN) increased by 2.0% vs. the S&P 500 and Dow that decreased 0.9% and 1.1% respectively. Canadian Solar (CSIQ), Azure Power (AZRE), First Solar (FSLR), SolarEdge (SEDG) and Enphase (ENPH) all delivered a strong Q2 and strong guidance for Q3.
A number of upstream solar company stocks in China and the U.S. increased on expectations for greater China demand in H2 2019. NEA is expected to release a list of solar projects that secured subsidies for 2019.
The top five performers were SolarEdge (SEDG), Daqo New Energy (DQ), Enphase (ENPH), TerraForm Power (TERP) and Canadian Solar (CSIQ) that increased 22%, 19%, 12%, 9% and 8% for the month, respectively. Roth analyst Phil Shen indicated that mono PERC cell pricing could increase by a few RMB pennies/W near-term. Although there is caution around China demand in H1 2020 after an expected surge in H2 2019, selling price increases near term are expected to drive stocks higher.
China domestic multi grade polysilicon is $8.07/kg, which declined 4% from June. Mono grade poly is now $10.62/kg. Multi and mono wafers are $0.06/W and $0.09/W, multi and mono cell price is $0.11/W and $0.12/W, multi and mono module price is $0.22/W and $0.26/W.
Despite strong solar industry fundamentals, macro economic sentiment will drive the stock market. Namely decreased economic activity in the United States and globally, exacerbated by trade war with China. On 08/23, the Dow dropped more than 600 points after President Trump said U.S. companies must look for an “alternative to China”.
Roth is hosting its seventh Annual Solar & Storage Symposium at Solar Power International on September 24-25, 2019 in Salt Lake City, Utah. The Symposium will include meetings with management teams of public and private companies and a booth tour visiting a variety of distributors, developers and renewable asset owners. We will focus our symposium around four main topics: (1) What to expect ahead for the global supply/demand balance; (2) Outlook for U.S. solar, especially residential; (3) The evolving competitive landscape of the inverter market; and (4) The economics of the solar supply chain.
Jesse Pichel, ROTH Capital Partners
August 2019: Awaiting your demand
 Solar stocks outperformed the broader market in July. The Guggenheim Solar ETF (TAN) gained 2.4% vs. the S&P 500 and Dow, which both increased ~0.5%. The top five performers in the U.S. stock market were Enphase (ENPH), Intevac (IVAC), Applied Materials (AMAT), TerraForm Power (TERP) and Azure Power (AZRE), with increases of 54%, 8%, 8%, 8%, and 5%, respectively.
Solar stocks were driven higher in July by strong earnings posted by major companies and positive expectations for Chinese demand in the third quarter. The interest rate cut also helped shares of project developers TERP and AZRE, which give them access to cheaper capital.
The U.S. residential market is strong. Enphase and SolarEdge both reported solid results and positive Q3 forecasts, with 39% and 30% increases, respectively. Sunnova Energy (NOVA) also successfully raised $168 million through its IPO on the New York Stock Exchange.
The broader market, however, was depressed due to concerns about weaker economics, indicated by this first interest rate cut in 10 years. Trade negotiations between the United States and China have also entered a more difficult phase.
Although demand in China is expected to pick up in August or September, there is some downside pressure on pricing now. China’s domestic multi grade polysilicon is at $8.44/kg, down 3% from June. Mono-grade poly is now at $11.06/kg. Multi and mono wafers are $0.06/W and $0.09/W, multi and mono cell pricings are $0.11/W and $0.14/W, and multi and mono module prices are at $0.22/W and $0.27/W, respectively.
Daqo New Energy (DQ), Canadian Solar (CSIQ) and JinkoSolar (JKS) will announce earnings in the next three weeks. We expect management will provide clearer guidance on China’s Q3 demand and supply chain pricing. Looking ahead, we expect more volatility in stocks as companies report earnings and the trade war intensifies.
July 2019:Upwards spiralling
Solar stocks outperformed the broader market in June. Following SNEC — the largest solar conference in the world, in the largest solar market in the 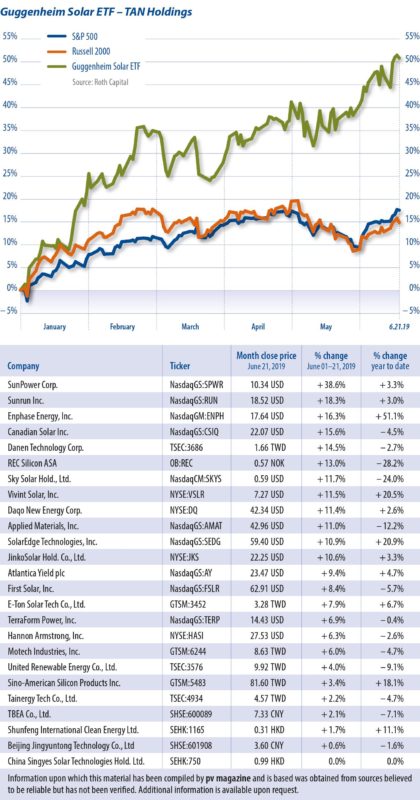 world — the Guggenheim Solar ETF (TAN) gained 9.1% vs. the S&P 500 and Dow, which increased 7.2% and 7.7%, respectively.
The top five performers in the U.S. stock market are SunPower (SPWR), Sunrun (RUN), Enphase (ENPH), Canadian Solar (CSIQ) and Vivint Solar (VLSR). They increased 39%, 18%, 16%, 16% and 12%, respectively. Stocks were driven by expectation of a trade deal ahead of President Xi and Trump’s G20 meeting, the outlook for a dovish Fed, positive industry sentiment on healthier fundamentals, Section 201’s bifacial exclusion, and Huawei’s exit from the U.S. inverter market.
The outlook for international demand remains strong. While China may be a little slower than expected in the third quarter, industry participants believe the key to its installation size in 2019 will be the timing of the National Energy Administration’s release of the subsidized project list.
The latest forecasts from Roth analyst Phil Shen for China and the world are 35 GW and 105 GW in 2019, 50 GW and 135 GW in 2020, a year-on-year increase of 43% for China and 28% for the world in 2020. The other impression is that the industry is shifting rapidly to mono. Mono wafer capacity could reach 120 GW by year-end 2020. Both Longi and Zhonghuan have aggressive expansion plans and we learned from the trip that the latest entrant, Wuxi Shangji Automation Industry, has invested in a 5 GW mono wafer plan.
In June, the United States Trade Representative announced a Section 201 exemption for bifacial modules. Both JKS and CSIQ gained 2.8% and 2.5% after the announcement. The other big news is that Huawei shut down its U.S. inverter sales on June 21. Roth analyst Philip Shen called it the end of a chapter and it could be positive for other major inverter suppliers in the U.S.
Year to date, solar stocks significantly outperformed the broader market, with TAN increasing 51%, while the S&P 500 and Dow gained 18% and 15%. For Y2 2019 and 2020, the industry will be surrounded by noise from the trade war, while demand is there and a new upcycle expected.
Author
Jesse Pichel, Roth Capital Partners
June 2019: Demand outside of China
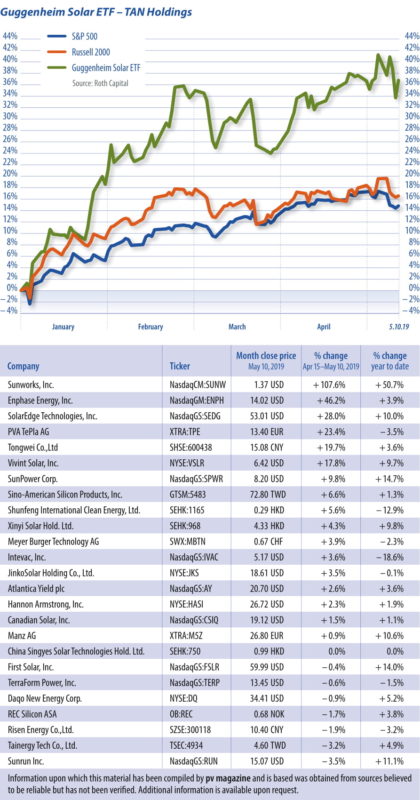 With market growth in a range of markets exceeding expectations, solar stocks are continuing to perform strongly. The Guggenheim Solar ETF (TAN) was up 2.7% from the previous index, while S&P 500 and Dow decreased.
Solar stocks outperformed the broader market since our last publication. The Guggenheim Solar ETF (TAN) increased 2.7% vs. the S&P 500 and Dow, which decreased 0.8% and 1.7%, respectively. The top five performers in the U.S. stock market are Sunworks (SUNW), Enphase (ENPH), SolarEdge (SEDG), Vivint Solar (VLSR), and SunPower (SPWR), which increased 108%, 46%, 28%, 18%, and 10%, respectively.
Solar stocks have also been driven higher by strong earnings and management guidance. Global solar demand outside of China is strong.
In the past month, Roth research analyst Phil Shen increased his United States, European Union, India, and Vietnam 2020 forecast by a total of 8 GW to 22 GW, while he revised down his China 2019 estimate to 40 GW from 50 GW, due to the policy uncertainty following the Chinese National Energy Agency’s release of the winning projects for subsidies.
Trade disputes
In the short term, the stock market will still be driven by the trade negotiation between Washington and Beijing, which the solar industry has experienced for the past two years.
In the longer term through 2020, we believe the U.S. solar market will lead investors’ positive sentiment in solar stocks with California’s solar mandate for new homes built in 2020 and later, and the pull-in of demand driven by the step-down and phase-out of the Investment Tax Credit.
We continue to see module price strength in the United States, which supports companies’ stocks with more U.S. exposure.
With Intersolar Europe last month, and more Chinese solar companies having reporting earnings over two in May, more visibility from the industry is emerging as to where we are and how these companies position themselves in the upcycle.
May 2019: Residential drive
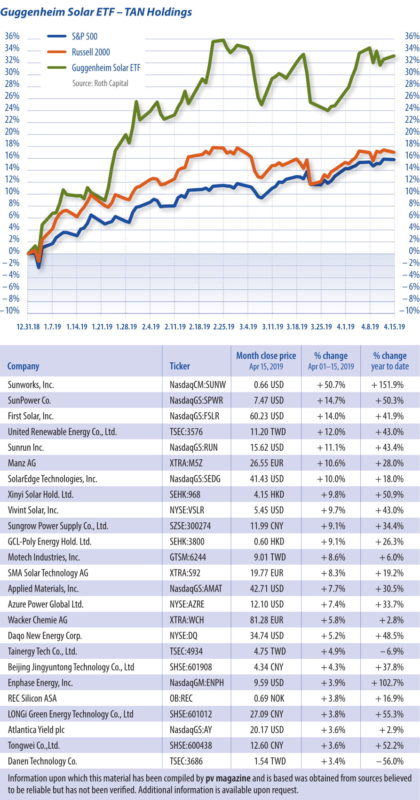 Solar stocks outperformed the broader market in April. Month-to-date, the Guggenheim Solar ETF (TAN) increased 6.7% versus the S&P 500 and Dow that gained 2.5% and 1.8% respectively.
The top five performers in the U.S. stock market are Sunworks (SUNW), Sunpower (SPWR), First Solar (FSLR), Sunrun (RUN), and SolarEdge (SEDG), that increased 51%, 15%, 14%, 11%, and 10%, respectively. Stocks were driven by stronger than expected demand in the United States, especially in the residential sector. Post-ROTH annual March conference, ROTH research analyst Phil Shen increased his U.S. 2019 forecast from
11 GW to 12 GW, which represents 16% YoY growth in the U.S. market, and the incremental demand is mainly in the residential sector. We had two top 10 installers at the ROTH conference that see potential for them to grow more than 30% YoY in 2019. Sunpower (SPWR) hosted its first analyst day in a number of years, highlighting its restructured growth story, and echoed positive commentary around strong growth in the residential and C&I sectors in the United States.
Another driver is China’s National Energy Administration’s (NEA’s) affirmation on 2019 solar subsidy. The document was released on April 12, and Chinese company stocks reacted favorably to the news with DQ, JKS, and CSIQ closed up 5%, 3%, and 2% on that date. However, NEA also issued a document that gives higher priority to parity projects versus subsidized projects and encourages approved projects from 2018 or before to convert to parity projects. The critical factor to determine the volume of 2019 installations will likely be based on when the NEA announces its approved list of winning projects for the subsidy. Before the industry gets more clarity on that, we believe pricing softness may continue into Q3. As of this week, most of the upstream pricing has been flat compared with that in the first week of April while multi-grade poly decreased 3.3% to $8.60/kg and multi wafer decreased 2.6% to $0.06/W.
New gigawatt markets are rising: Taiwan, Vietnam, Pakistan, and others all announced new targets that are creating meaningful new pockets of longer-term demand.
Jesse Pichel, ROTH Capital Partners
April 2019: Flat or falling
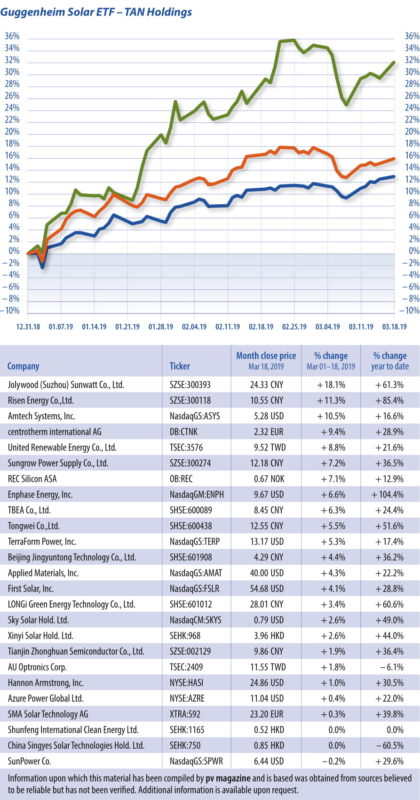
Table: pv magazine
Solar stocks underperformed the broader market in March. MTD, the Guggenheim Solar ETF (TAN) decreased 1.6% vs. the S&P 500 and Dow, which gained 1.7% and were flat respectively.
Our sources indicated flat / slight reduction in supply chain pricings for March, which could be driving the sector stocks down in this period. In China, domestic multicrystalline grade polysilicon was priced at $10.43/kg, down 4% compared with the February average of $10.89/kg.
Monocrystalline grade polysilicon is now priced at $11.92/kg, multi & mono wafer pricings are at $0.07/W and $0.10/W, multi & mono cell pricings are at $0.13/W and $0.15/W, multi and mono module pricings are at $0.28/W and $0.28/W, respectively.
Takeaways from ROTH conference
We held our 31st annual conference in Dana Point, California from 17-19 March, with over 80 cleantech companies participating, of which nine are solar companies including Daqo, Enphase, PetersenDean, ReneSola, SolarEdge, Sunnova, Sunrun, Sunworks, and Vivint Solar.
Despite flat / slight reductions in supply chain pricing, our meetings from the conference suggest tighter supply through 2019, driven by strong demand in the U.S. residential sector. According to ROTH research analyst Phil Shen, the United States is expected to install 11 GW of solar in 2019, representing 9% YoY growth, while we have two top 10 residential installers that see potential for them to grow more than 30% YoY in 2019. With limited module production capacity in the United States, residential installers that could secure module supply, especially the supply of monocrystalline silicon products, may be able to win more market share. The inverter companies with more U.S. residential exposure will also benefit from the strong growth in the sector.
On the polysilicon side, capacity expansion from China may be later than expected. It will be interesting to see what type of trade settlement would be reached between the United States and Chinese governments in April.
Jesse Pichel, ROTH Capital Partners
March 2019: PV feeling the spring fever
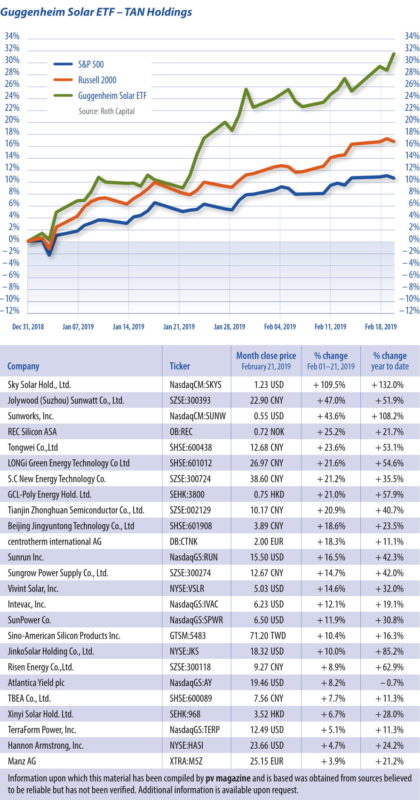
The investor sentiment in the solar sector was very strong in February. Month-to-date (MTD), the Guggenheim Solar ETF (TAN) increased 4.7% versus the S&P 500 and Dow that gained 2.6% and 3.4% respectively. The sector outperformance was mainly driven by China’s potential new solar policy which reintroduces PV subsidies at the national level, and also the strong expectations for PV demand in the USA for 2019/2020. The top performing solar stocks in the U.S. market MTD are Sunworks (up 44%), Sunrun (up 17%), Vivint Solar (up 15%), SunPower (up 12%), and JinkoSolar (up 10%).
In early February, ROTH research analyst Phil Shen increased the China demand forecast to 50 GW for 2019, an increase from the prior forecast of 45 GW for 2019 and China’s 2018 installation volume of 44 GW. Outside of China, we have seen pricing through the upstream and midstream solar supply chain improve meaningfully with mono wafer ASPs up 6.6% YTD, multi high-efficiency ASPs up 7.3% YTD, mono cell ASPs up 4.7% YTD, and multi wafer ASPs up 2.2% YTD.
We are hearing some industry concerns of a possible shortage of U.S. modules (compliant/tariff-free) which dovetails with large growth expectations for the USA. Despite the growth in the USA, there are some uncertainties around utility-scale power purchase agreements (PPAs) following PG&E’s filing for bankruptcy last month. The New York Times is reporting that the bankruptcy will allow PG&E to revoke or renegotiate solar PPA contracts lower. This could hurt downstream project owners that borrow money based on higher priced PPAs. (The New York Times, 01/17/2019). ROTH anticipates USA market demand of 11.3 GW in 2019 and 14.6 GW in 2020.
Earnings season for solar companies has now begun and investors will gain some market volume and price clarity with public company guidance and news emanating from PV Expo in Tokyo. We anticipate stock volatility will ensue.
Jesse Pichel, ROTH Capital Partners
February 2019: Cautious optimism
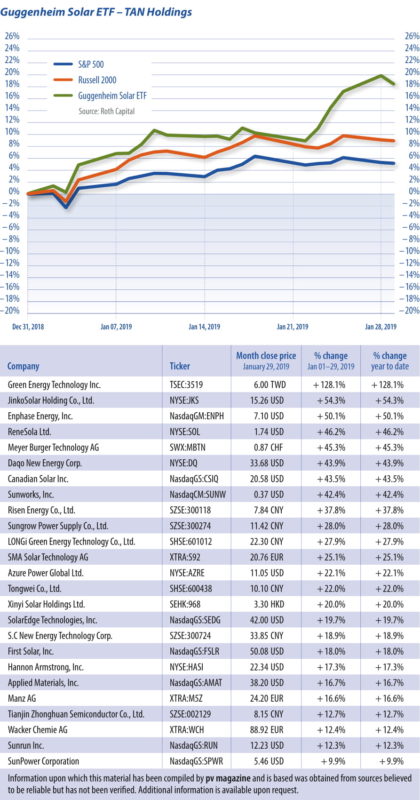
Sentiment in solar stocks improved on the better-than-expected China 2019 outlook. Year-to-date (YTD), the Guggenheim Solar ETF (TAN) increased 19% versus the S&P 500 and Dow that gained 5.3% and 5.4% respectively.
The solar sector’s outperformance was mainly driven by China’s potential new solar policy which reintroduces PV subsidies at the national level. To recall, on May 31, 2018, China announced that traditional utility-scale projects won’t be eligible for the 2018 FIT until an update is provided, and 2018 distributed generation demand would be capped at 10 GW. The announcement was a major shock to the industry and institutional investors.
Demand destruction
The major impact of the demand destruction in China has been the collapse of Chinese PV demand, as well as the collapse of upstream pricing – 2018 solar installations in China were only around 40 GW, down 25% compared with 2017’s installation of 53 GW.
In the stock market, the TAN declined 26% over 2018 as a result of the demand destruction. With the potential reintroduction of the national subsidy, the new solar policy, if implemented, could drive an increase in Chinese demand to around 50 GW for the full year 2019, according to ROTH research.
Upstream issues
Upstream pricing, on the other hand, has remained flat since the release of the new draft policy. As of January 25, the pricing of polysilicon is at $9/kg, mono wafers at $0.08/W, multi wafers at $0.06/W, mono cells at $0.13/W, multi cells at $0.11/W, mono modules at $0.25/W, and multi modules at $0.23/W.
The other key questions from investors would be: 1) How will the new subsidies be funded, given the huge deficit and delay in PV subsidy payments? 2) And what quota could be included in the final policy, given its transition in focus from subsidy to competition?
Although prices have not increased, there is increased chatter about tight supply in the second half of the year in the United States, at a time when new project construction is surging.
Jesse Pichel, ROTH Capital Partners
January 2019: Tariffs ringing in 2019
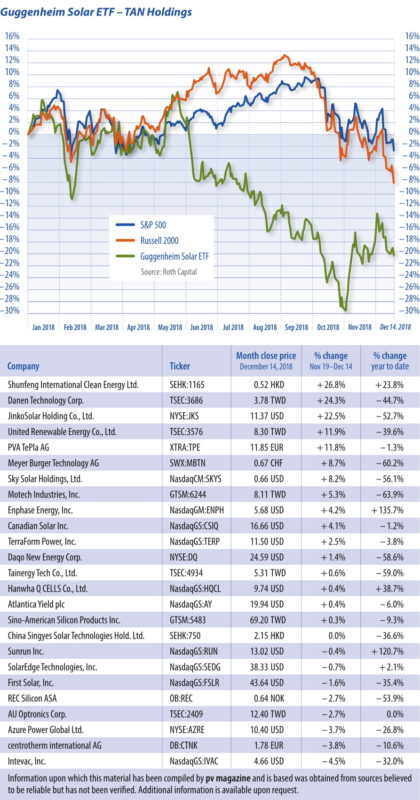 Last year was obviously an extremely difficult year for solar stocks, but it could have been worse. Solar stocks were driven by three themes this year: China’s policy shift; strong U.S. demand; and the unfolding U.S.-China trade war.
The Guggenheim Solar ETF (TAN) decreased 20% YTD versus the S&P 500 and Dow that declined 2.8% and 2.5% respectively. Best performers in the U.S. YTD are Enphase (ENPH), Sunrun (RUN), Hanwha (HQCL), Vivint Solar (VSLR), and SolarEdge (SEDG) up 136%, 121%, 39%, 13%, and 2.1% respectively.
YTD, polysilicon dropped 44% to $9.50/kg in December; mono and multi wafers are now at $0.08 and $0.06/W, a 48% and 56% YTD decline; mono and multi cell prices are $0.13 and $0.11/W, a 40% and 47% YTD decline. Module prices are $0.25 and $0.23/W.
Polysilicon stocks (REC, DQ, Wacker, and GCL-Poly) decreased 57% on average. Both Longi and Tongwei fell 28% in the Chinese market, Canadian Solar and JinkoSolar dropped 1.2% and 53% respectively.
Canadian Solar held up better due to earlier planned privatization and stability from downstream projects in the West and Japan.
U.S. solar continues to grow, thanks in part to the China shift and resulting oversupply. Projects for 2019 and 2020 are penciling out at or near natural gas prices and utilities and corporations continue to secure solar. Demand is driven by 100% clean energy goals for California and others, energy storage, endless demand from data centers, and solar requirements for new homes.
Sunrun and Vivint Solar gained 121% and 13% YTD respectively. According to Roth analyst Phil Shen, 2019 U.S. solar installation is expected to increase 28% YoY to 12 GW from 9.5 GW in 2018, driven by a rush to install ahead of ITC subsidy reductions.
Solar was one of the first industries impacted by tariffs, starting from Section 201 and followed by Section 301. President Trump met with China’s President Xi in Argentina and agreed to work on negotiating a trade agreement between the nations. As Section 301 tariffs were slated to increase from 10% to 25% on January 1, 2019, the result of this negotiation would be the main driver for the stocks in the remainder of 2018 through H1 2019.
Jesse Pichel, ROTH Capital Partners
December 2018: Moment in the sun
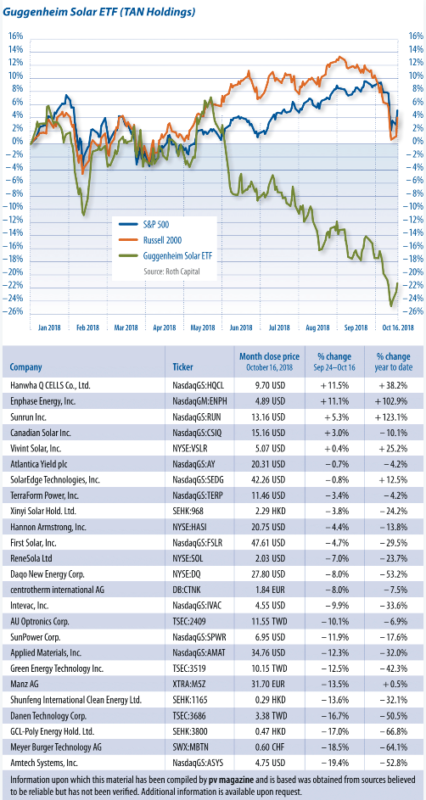
Solar stocks have outperformed the broader market since our last publication on October 16.
The Guggenheim Solar ETF (TAN) increased 6.5% versus the S&P 500 and Dow that declined 2.8% and 1.7% respectively. Despite the global stock sell-off, solar stocks have had one of their best months in H2 2018 since the China solar policy change.
On November 2, the National Energy Administration (NEA) of China held its mid-term review meeting for the country’s 13th Five-Year Plan (2016-2020). During the meeting, solar policymakers set a positive tone around new installation targets. Some expect a new 2019 target of ~45-50 GW, and see the potential for demand to exceed this target.
As a result of the NEA meeting, Jinko (JKS), Canadian Solar (CSIQ), and Daqo New Energy (DQ) gained 3%, 2%, and 6% respectively on the day the news was released. In the Chinese market, Longi and Tongwei increased 10% and 7% on that day. However, the solar subsidy deficit in China remains the key concern for investors. Reportedly, the deficit for the FIT is CNY 120 billion ($17.4 billion) and payments for more than 20 GW of completed projects remain delayed.
2019 Market flood
The gap between polysilicon supply and demand is widening. Tongwei recently opened a new 25,000 metric ton polysilicon production facility in Inner Mongolia. Additionally, Chinese antidumping tariffs on U.S. polysilicon are expected to expire in January 2019.
If allowed to expire, companies like OCI, Hemlock, REC Silicon, and Wacker Chemie U.S. may gain access to the Chinese market, thereby flooding it. As of 15/11, the Chinese polysilicon domestic price is $10.22/kg, down from $12/kg at Intersolar North America in July. For wafers, multi and mono wafers are at $0.06/W and $0.08/W, down from $0.07 and $0.09 in July. Multi and mono c-Si cells are at $0.11/W and $0.13/W, down from $0.14 and $0.15 in July. Module prices have also dropped to $0.22/W, down from $0.26 in July
Jesse Pichel, ROTH Capital Partners
November 2018: Positive currents from SPI
Sentiment from downstream utility and residential solar companies at SPI was extremely positive. One would never know that China’s demand imploded and the U.S. imposed solar trade tariffs.
Despite fears that tariffs would decimate the U.S. solar industry, the industry continues to grow, thanks in part to the China 31/5 policy shift and resulting massive oversupply.
Solar projects for 2019 and 2020 are penciling out at or near natural gas prices and utilities and major corporations continue to secure solar. U.S. demand drivers widely discussed are 100% clean energy goals for California and other places, energy storage, endless energy demand from data centers, and solar requirements for new homes. The ITC is plentiful again, and tax equity returns are now 6-7% for utility-scale, and may be headed lower. Despite this good news, stocks have traded poorly given the U.S.-China trade war and rising interest rates which affect all stocks.
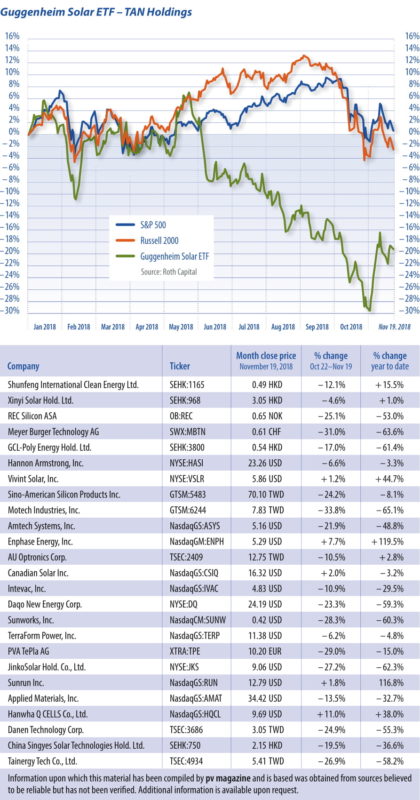
Since Solar Power International (SPI), the Guggenheim Solar ETF (TAN) declined 8.3%, underperforming the broader market, which saw the S&P 500 and Dow fall 4.1% and 3.5% respectively. Year-to-date (YTD), the TAN index declined 21%, compared with the S&P 500 and Dow that were up 5.1% and 4.4% respectively.
Just a week before SPI, SunPower (SPWR) was granted an exclusion from the 30% section 201 import tariffs for its IBC cells and modules. The stock closed up 14% when the news came out on September 19. As Enphase’s (ENPH) micro-inverter is considered a component within SPWR’s AC modules, ENPH has been one of the best performing stocks since SPI (up 11%). Looking at the demand indicator, poly pricing, China domestic strike price is at $11/kg. On October 15, DQ announced it has begun pilot production at its new Phase 3B polysilicon facility which expands its capacity to 30,000 mt at full ramp by the end of Q1 2019. With more production capacity resumed, we believe near-term pricing would still be under pressure but hopefully supported by stronger demand in China in Q4. YTD, polysilicon stocks have declined over 56% on average. (Shares of GCL-Poly: -67%; REC: -62%; DQ: -53%; Wacker: -42%)
October 2018:
Silicon and inverters slip
Month-to-date (MTD), the Guggenheim Solar ETF (TAN) was down 3.5%, underperforming the broader market, which saw the S&P 500 and Dow up 0.1% and 1.1% respectively.
While all solar sectors dropped ahead of SPI Anaheim on September 25, inverter and polysilicon stocks were hit hardest by a new round of tariffs and the weakness in polysilicon prices, which fell 10% and 9% on average, respectively.
On Friday September 14, U.S. President Trump approved tariffs on the $200 billion list of imports from China, which includes inverters. The initial tariffs will be 10% and raised to 25% at the end of the year. SolarEdge (SEDG), Enphase (ENPH), and SMA (S92) have dropped 12%, 11%, and 8% MTD. In contrast, on September 18, the U.S. granted Sunpower (SPWR) an exclusion from the 30% Section 201 tariffs for its IBC cells and modules, which made SPWR one of only two tariff-free module importers to the U.S. market. SPWR stock closed up 15% after the announcement. On the polysilicon side, pricing resumed its WoW decline to approximately $11.68/kg in the China domestic market due to weaker than expected wafer demand. MTD, Daqo (DQ), REC Silicon (REC), and Wacker (WCH) stocks have dropped 17%, 10%, and 9%.
Year-to-date, the Guggenheim Solar ETF (TAN) was down 16.2% versus the S&P 500 and Dow up 8.6% and 6.2% respectively. Within solar, on average, polysilicon stocks (Daqo GCL-Poly, REC, and Wacker) have dropped 49%, module manufacturers (Canadian Solar, First Solar, Hanwha, JinkoSolar, and SunPower) have decreased 15%, and equipment manufacturers (Amtech, centrotherm, Intevac, Manz, Meyer Burger, and PVA) have experienced a decrease of 17%.
At the 6th Annual ROTH Solar & Storage Symposium in Anaheim (September 25-26) we will host meetings with solar and storage firms, in addition to a booth tour at SPI and networking reception. We believe our events keep investors ahead of the curve on what to expect for the global supply/demand balance, given the 31/5 policy shock, outlook for U.S. solar, future competitive landscape of the inverter market, and economics of the solar supply chain.
Jesse Pichel, ROTH Capital Partners
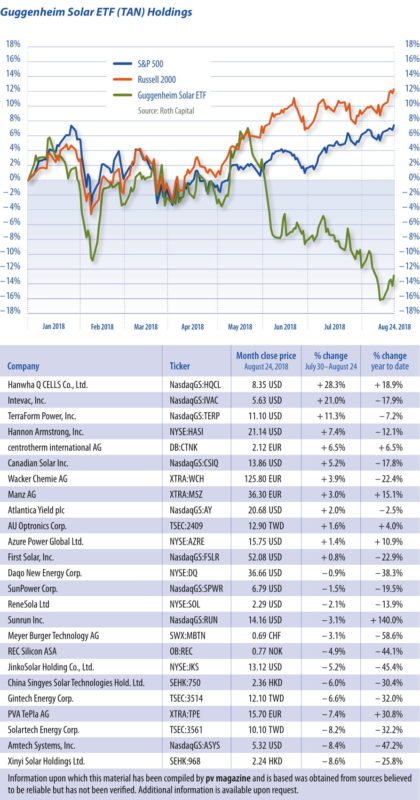
Table: Guggenheim Solar
September 2018:
Solar stocks slipping
Solar stocks underperformed the broader market last month (7/30-8/24): The Guggenheim Solar ETF (TAN) dropped 3.8% versus the S&P 500 and Dow up 2.0% and 1.3%, respectively. Year-to-date (YTD), TAN has substan- tially underperformed the market, drop- ping 12.9%, compared with the S&P 500 and Dow up 7.5% and 4.3%. Within solar, the only two performing sectors YTD are residential installers (Vivint Solar, Sun- run, and Sunworks), and inverter manu- facturers (SolarEdge, Enphase, and SMA), which increased 45% and 40% on average. Equipment manufacturers, polysilicon producers, ingot/wafer/cell manufactur- ers, module manufacturers, and down- stream IPP/yieldco stocks were adversely impacted by negative sentiment from the
31/5 policy. On average these sectors have dropped 12%, 42%, 32%, 17%, and 4% YTD, respectively. In August, the top two performing sectors were module manu- facturers and IPP/yieldco, which had an average increase of 5.5% and 1.0%. We believe strength in these two sectors is driven by two key factors: (1) The EU is set to end Chinese module import control in September; and (2) strong earnings results posted by IPP/yieldco firms. Meanwhile, polysilicon prices have been flat and sta- ble at ~$12/kg since China revised its solar subsidy policy. Multiple polysilicon plants remain shuttered for maintenance.
ROTH hosts its sixth annual Solar & Storage Symposium on Tuesday, Septem- ber 25 and booth tour on Wednesday, Sep- tember 26 at Solar Power International, with 17 companies confirmed. Solar firms include ASYS, AZRE, CSIQ, DQ, ENPH, JKS, LONGi, RUN, SEDG, SOL, SUNW, and VSLR. Storage firms include AMRC, MXWL, Primus Power, sonnen, and WLDN. Our focus will be on four issues: (1) current state of global supply/demand imbalance given the 31/5 policy shock; (2) Outlook for the U.S. solar market, espe- cially residential; (3) the future competi- tive landscape of the inverter market; and (4) economics of the solar supply chain.
Jesse Pichel, ROTH Capital Partners
August 2018: Upstream down, downstream up
Stock price index: The major impact of demand destruction in China has been the collapse of upstream pricing. Polysilicon prices fell from $17 to $12 despite most major plants shutting down for “annual maintenance” ahead of schedule. Wafer prices have been reduced from CNY 4.80 to 3.30, and module cost will reach low $0.20s ahead of schedule, allowing a mid to high $0.20s module price for major markets. Year-to-date, the stocks of Daqo New Energy (DQ), Wacker, REC Silicon, GCL-Poly, LONGi, Tongwei, Canadian Solar, and JinkoSolar have dropped 35%, 25%, 45%, 49%, 40%, 42%, 21%, and 41% respectively.
Next year is expected to be a tremendous one for U.S. projects, driven by low costs and a pull in of demand ahead of ITC phased reductions. Year-to-date, Vivint Solar and Sunrun stocks have increased 46% and 156%. For July, the Guggenheim Solar ETF (TAN) increased 1.7% versus the S&P 500 and Dow each up 4.7%. The top five performing stocks in the U.S. are SolarEdge (SEDG), Vivint Solar (VSLR), Sunrun (RUN), Canadian Solar (CSIQ), and DQ, which gained, 21%, 19%, 15%, 9.3%, and 8.5% respectively. Downstream company stocks keep performing due to the lower module price and pull-in of demand. Upstream manufacturer stocks slightly recovered due to short-term price stabilization caused by the shutdown of capacity.
On July 25, the China Photovoltaic Industry Association (CPIA) issued its H1 2018 statistics and H2 2018 forecast. It forecast 2018 China demand of 35 GW+, indicating 10 GW+ in the second half (China installed 24 GW in H1). According to CPIA, China produced 140 MT of poly, 50 GW wafer, 39 GW cell, and 42 GW module in H1, year-on-year growth of 24%, 39%, 22%, and 24% respectively. For 2018, it estimates the utilization rate across wafer, cell, and module could drop to 67%, 58%, and 48%.
In the U.S. it will be interesting to see how domestic manufacturers react to the new policy in China and its effects on the U.S. market.
Jesse Pichel, ROTH Capital Partners
July 2018: Solar Stocks Slipping
Stock price index: Solar stocks significantly underperformed the broader market in June. The Guggenheim Solar ETF (TAN) decreased 8.2% vs. the S&P 500 and Dow down 0.6% and 1.5%, respectively. The general investor sentiment around the solar industry is very negative due to the shocking policy change in China. Pricing is on the decline. Polysilicon pricing appears to have hit $12/kg which represents a drop of >40% YTD. Correspondingly, GCL-Poly, Daqo, and Wacker stocks dropped 15%, 22%, and 33% in June, respectively. The wafer pricing has dropped to RMB3.3/wafer from RMB4.2/wafer at SNEC in late May. Jinko, FirstSolar, Canadian Solar and LONGi dropped 9%, 20%, 22%, and 25% in June, respectively. On the inverter side, Enphase increased 16% due to its acquisition of SunPower’s microinverter business, SolarEdge and SMA stocks dropped 13% and 32%.
We have seen several announcements from Heliene, Itek Energy, Mission Solar, Seraphim, Solaria, SolarTech Universal, Sunpower, Suniva, SunSpark and Tesla/Panasonic.
JinkoSolar (JKS) was the first mover among Asian solar manufacturers to announce a new USA plant. Most recently, Hanwha Q Cells Korea Corporation announced that it will build a solar PV module manufacturing facility in Whitfield County, Georgia.
Construction will commence in 2018, and the facility is scheduled to be completed in 2019. However, given the steep price decline of poly and wafer in China, it may be cheaper to pay the tariff than build the manufacturing in the USA.
With the JunQ earnings season coming, we expect more company announcements on how strategy will alter with the policy change in China.
Jesse Pichel, Roth Capital Partners
 June 2018: Choppy waters ahead!
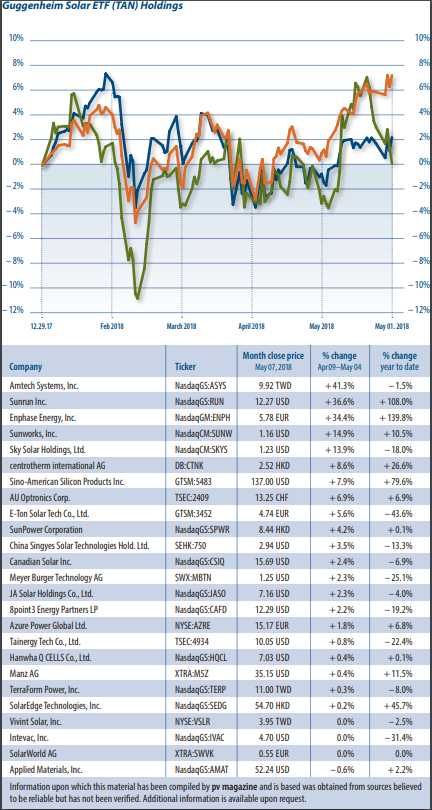
Stock price index: Solar stocks may be stuck in a malaise for the short term as demand in China wains, however, the higher efficiency transition will be the key driver of the industry longer term.Solar stocks outperformed the broader market last month (5/7-6/1), the Guggenheim Solar ETF (TAN) rose 3.8% vs. the S&P 500 and Dow up 2.7% and 1.5%, respectively. Despite this, we expect volatility due to the new policy in China. On 5/31, China’s NEA released its ‘Solar Management Plan’, the update is more severe than expected. It appears traditional utility scale projects will not be eligible for the 2018 FIT until an update is provided, and 2018 DG demand will be capped at 10 GW. Additionally, the 2018 FITs for utility scale projects and fully grid-connected DG projects were lowered by ~6-9%.
Canadian Solar (CSIQ), Jinko Solar (JKS) and Daqo New Energy (DQ) in the U.S. stock market dropped 5.5%, 14%, and 8.6% after the announcement. LONGi (SH601012), Tongwei (SH600438), and GCL-Poly (HK3800) in the Asian market dropped 10%, 10%, and 9.2% on the first day trading after the release.
Other takeaways from SNEC include: High efficiency is driving demand and transition to mono. There is some debate on the future of multi. Tier 1 suppliers may find themselves becoming obsolete as new entrants ramp higher efficiency, with lower capex /W.
Poly and cell: capacity is expected to rise significantly in 2018, as a result, pricing is expected to decline. The pricing for mono wafer, which has been tight, is now CNY4.2/pc from Longi and expected to be CNY3.80 by the end of the year.
Module: Some OEMs see pricing nearing $20c/W by 2020, while this is certainly grid parity, storage prices are still too high. If storage can mirror the capital formation witnessed in PV over the past 12 years, grid parity (PV + Storage) is just a matter of time.
Inverter: Despite noise, we have not seen any real volume of Chinese inverters penetrating the U.S. markets for smaller systems like MLPE. However, utility and C&I companies in the U.S. are using Chinese inverters. Trade conflicts are likely to hinder inverter exports near term.
Jesse Pichel, Roth Capital Partners
April 2018: Conference findings
Stock price index: A vibrant ROTH conference saw brisk interest in the solar inverter investment space, while storage backers are in it for the long game.
Last week, ROTH Capital held its 30th Annual ROTH conference with 94 Cleantech firms joining, including 28 solar and storage companies. Despite the noisy and dramatic nature of the solar industry, investors remain very interested in solar, especially inverter investments.
The investor outlook for SolarEdge and Enphase remains quite positive with better pricing and more feature-sets vs. Huawei and other new competitors. The worst-case fears have been alleviated. The Section 201-related solar downturn in the U.S. during the second half of 2017 appears to be over. Downstream growth is resuming, however, with many of the large developers sitting on ample module inventory. Storage remains a key interest to investors, and the consensus view is that it will become much more prevalent with lower cost and better battery performance over the mid-term.
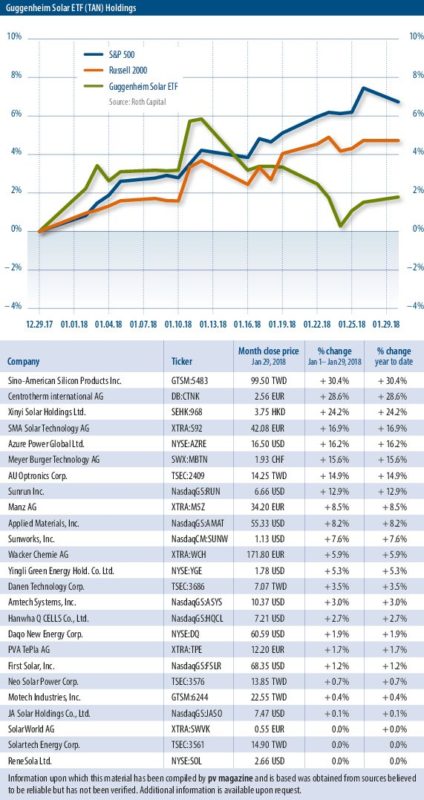
Solar stocks outperformed the broader market in March. The Guggenheim Solar ETF (TAN) increased 1.2% vs. the S&P 500 and Dow up 0.2% and down 1.4%, respectively. The inverter stocks remained strong for the period with Enphase, SMA, and SolarEdge gaining 91%, 17%, and 9%, respectively. This is in line with our observation at the ROTH conference. Huawei’s higher pricing and limited product feature-set seen in Europe alleviated investors’ fears about the competition.
The polysilicon stocks declined in the last few weeks of March, with Daqo and GCL-Poly dropping 20% and 12% since our last publication, respectively. Although Daqo delivered a strong Q4 in 2017 and better-than-expected Q1 2018 guidance, the stock still declined on weaker industry ASP outlook.
According to our analysis, more than 125K MT of polysilicon capacity announced in 2017 is expected to come online in 2018. This has negatively impacted investors’ sentiment in the poly stocks. China’s domestic poly price had dropped to $16.1/kg by the end of March, down from $20.4/kg in January 2018.
Jesse Pichel, ROTH Capital Partners
March 2018: Solar stocks on top
Stock price index: A better than expected outcome to the Section 201 case kept solar ahead in February. However, there are surely more strategy changes to be announced as a result.
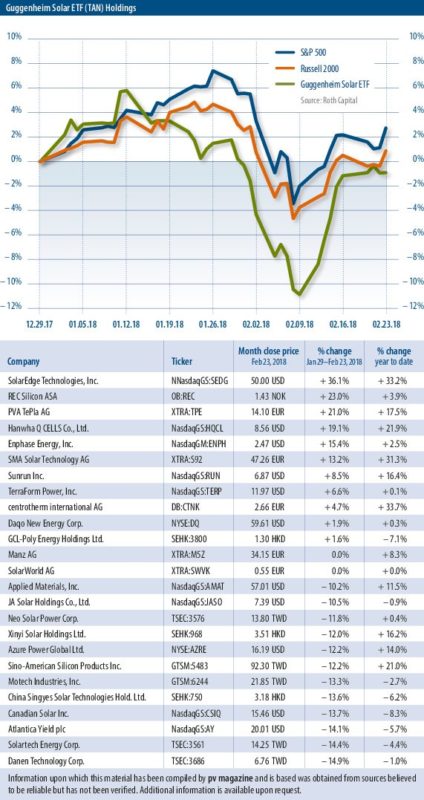
Solar stocks outperformed the broader market in February (29/01/2018–23/02/2018). The Guggenheim Solar ETF (TAN) dropped a mere 2.4% versus the S&P 500, Dow, and Russell 2000 down 4.4%, 4.9%, and 3.7% respectively.
We believe the outperformance of the solar sector compared with broader markets was due to consensus views that the final 201 tariff was fairly benign, and the best possible outcome for the industry at the present stage.
JinkoSolar (JKS) was the first mover among Chinese solar manufacturers to announce a new USA-based production facility. The stock gained 2.5% on
January 29 after they announced the plant. However, the stock dropped 21% in this period as it closed a ~$110 million follow-on offering at an ~11% discount. JKS intends to use the proceeds for its capacity expansion and upgrade including the construction and operation of its manufacturing facility in the U.S.
The best two performers in February were SolarEdge (SEDG) and REC Silicon (REC). SEDG gained 36% as it delivered a strong Q4 beat and an impressive Q1 guide.
The market has been worried about the competition from Asian players, but the Huawei higher pricing and limited product feature set seen in Europe alleviated those fears. REC gained 23% in this period on the heels of its Q4 results. REC was cash flow positive – the first time in three years.
With the DecQ earnings season coming, we expect stock volatility and more company announcements on how strategy will alter with the 201 result. In addition, ROTH is hosting its annual March conference with 94 Cleantech & Industrial Growth companies joining, including more than 28 solar and storage companies. We will have takeaways from the conference in our next issue. S
Jesse Pichel, ROTH Capital Partners
February 2018: An end to hyperbole
Stock price index: If the Section 201 ruling has taught the solar industry anything, it is that reason and nuance trump scaremongering every time.
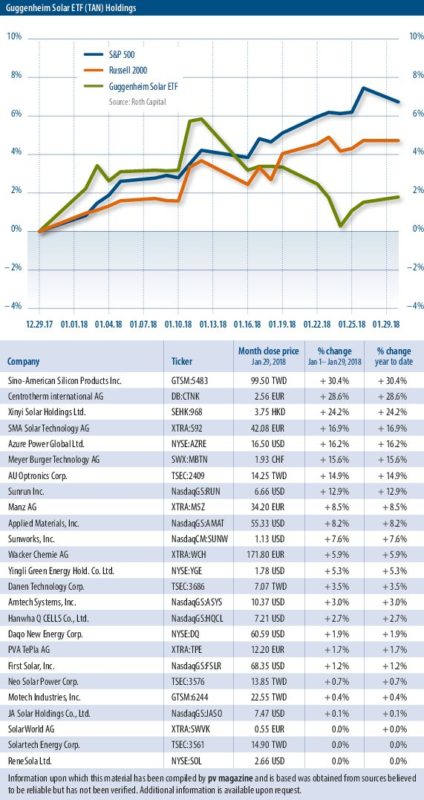
Solar stocks underperformed the broader market in January. The Guggenheim Solar ETF (TAN) increased 1.8% versus the S&P 500, while against the Dow it was up 6 .7%, and 7.7% against the Russell 2000. Investors are still scratching their heads on what the final Section 201 tariffs and tax reform could mean for global solar demand. Consensus is that the U.S. market may be somewhat smaller as a result of the trade action, but there is also an acceptance that the impact is likely to be more benign than first feared. Meanwhile, China continues to expand strongly, especially the nation’s distributed generation (DG) and rooftop markets.
Trump chose a tariff level (30%) at the bottom of the bipartisan ITC recommended range. Many observers question if the tariff would increase U.S. manufacturing: the JinkoSolar 1.5 GW plant announcement did not take long to materialize, and we are aware of others in the early planning stages.
We have now seen several solar trade issues globally. In Roth Capital Partners’ opinion, trade issues are unlikely to go away until there is viable solar manufacturing in the U.S. Our recommendation is that we should abandon the sky-is-falling and phantom job loss tactic, and lobby the administration with several “asks,” that could include: MLP/REIT status for solar companies; fast-track permitting; reducing environmental studies; tax-free manufacturing zones in the interest of U.S. national security and to revitalize certain cities; a revision of accounting rules that penalize solar project owners; federal policy allowing net metering for homeowners and community solar projects; including solar in the upcoming infrastructure spending bill; and finally increased PV deployment on federal buildings.
We find that these suggestions are more rational given the administration’s avowed support for U.S. employment and economic growth.
Jesse Pichel, ROTH Capital Partners
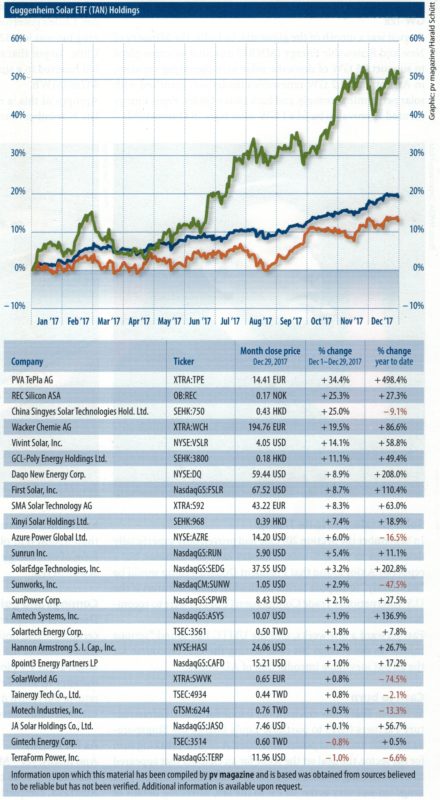
January 2018: Taking stock of 2017
Stock price index: A look back over solar stocks’ performance across 2017 finds three key themes: Chinese strength, a capacity upgrade cycle, and the U.S. Section 201 case.
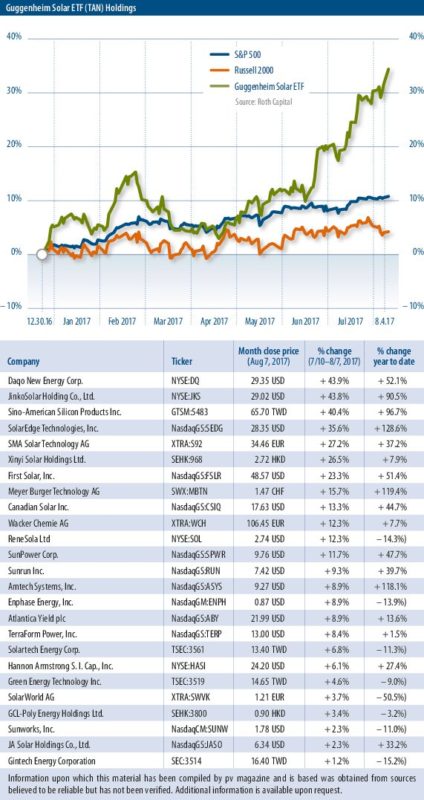
Solar stocks significantly outperformed the broader market in 2017. For the year of 2017, the Guggenheim Solar ETF (TAN) increased 51.7% versus the S&P 500, Dow, and Russell 2000 up 19.4%, 25.1%, and 13.1%, respectively. The top five solar stocks in the U.S. stock market were Daqo New Energy (DQ), SolarEdge (SEDG), Enphase (ENPH), Amtech System (ASYS), and First Solar (FSLR), which gained 208%, 203%, 139%, 137%, and 110%, respectively.
There were three key factors that drove the solar stocks and investor’s sentiment throughout 2017: 1) Strong China solar market demand; 2) A technology driven capacity upgrade cycle; and 3) The Section 201. We discussed these three factors below.
First, China year-to-date (YTD) through November 2017 saw a solar installation volume of 48.7 GW. This represents a YoY increase of 83%. The stronger-than-expected downstream demand in China drove the stocks of DQ, JinkoSolar (JKS), and Canadian Solar (CSIQ), which increased 208%, 58%, and 38% in 2017. Chinese domestic poly price exited 2017 at $20/kg versus $17/kg at the end of 2016.
Second, a technology-driven capacity upgrade cycle drove the equipment stocks. As the industry is shifting to mono and higher efficiency, we are seeing some equipment providers to benefit significantly from this capacity upgrade cycle. Meyer Burger (MBTN) and ASYS were the winners, and their stocks increased 160% and 137% in 2017, respectively.
And third, First Solar (FSLR) was the winner on Section 201 in 2017. The company’s stock increased 110% in 2017 as
7.7 GW of backlog was locked down due to the 201. Now all eyes are on the White House. President Trump is expected to make his decision on the trade case later this month, and the industry continues to see a $0.09 – $0.15 (30 – 50%) tariff, and also a low probability for a global settlement.
Jesse Pichel, ROTH Capital Partners
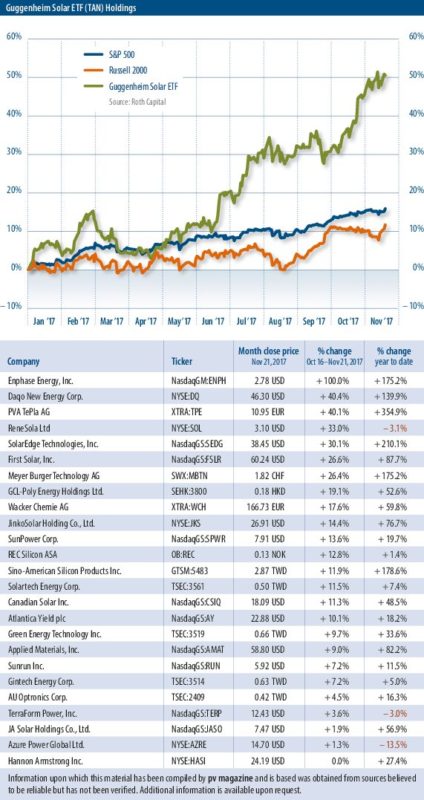
December 2017: Strong finish
Stock price index: Solar stocks outperformed the market last month. The Guggenheim Solar ETF (TAN) increased 13.5% versus the S&P 500 and Russell 2000, up 1.9%, and 1.1% respectively.
China installed 43 GW in the first three quarters of 2017, a YoY increase of 83%. This drove the China stocks of ReneSola (SOL), Canadian Solar (CSIQ), and JinkoSolar (JKS), which rose 42%, 11%, and 5% respectively during this period.
On November 21, the Ministry of Commerce of the People’s Republic of China increased tariffs on polysilicon imported from South Korea. The two major exporters to China, OCI and Hankook’s tariffs were raised from 2.4% and 2.8% to 4.4% and 9.5%, respectively. South Korea accounted for 21% of total supply in China in 2016. DQ gained 15% after the announcement and increased 62% since our last publication. The USITC recommendation alleviated concern over a new round of trade wars. The United States Trade Representative (USTR) is now reviewing the case and expected to hold a hearing on December 6 to hear from the industry. We don’t expect the USTR to present an alternative from USITC. All eyes are on the White House, and President Trump is expected to make his final decision on the remedy by January 12.
Jesse Pichel, ROTH Capital Partners
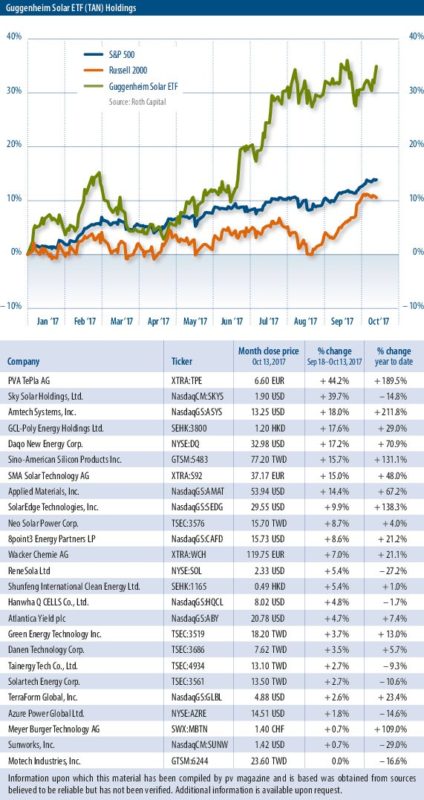
November 2017: In the balance
Stock price index:The aftershocks of the Section 201 decision have already been felt among solar panel makers in the U.S., but the longer-term impacts remain unknown. For now, at least.
Carrying on a trend evident in the previous month, PV equipment companies continue to trade higher. One of the main reasons for this is that new module technologies are driving the capex upgrade cycle, currently underway for PERC (Passivated Emitter Rear Contact) and PERT (Passivated Emitter Rear Totally Diffused). What’s more, polysilicon companies continue to perform well, as China’s polysilicon domestic price has reached $19/kg (excluding VAT).
On September 22, the United States International Trade Commission (USITC) voted four to zero in favor of injury in the Section 201 trade case, which was brought earlier this year by Suniva.
As a result of the USITC’s decision, stocks of panel makers were mostly down last month; FSLR, CSIQ, JASO, and JKS dropped 5.6%, 5.8%, 7.1%, and 18.1%, respectively. While nobody wants higher prices, there is heathy debate right now around if/how the U.S. should support a domestic solar industry.
Many Washington D.C. lobbyists see remote probability for a global settlement by mid-November, which would be a win for the overall industry. Some think, however, this may not be feasible as there is a lot that needs to be papered and confirmed with a variety of agencies. Interestingly, ahead of the final remedy recommendation on November 13, President Donald Trump may be visiting China before the Asia-Pacific Economic Cooperation (APEC) Summit, to be held in Vietnam from November 6 – 11.
Year to date, solar stocks have significantly outperformed the broader markets, with the Guggenheim Solar ETF (TAN) up 35.1% vs. S&P 500, Dow and Russell 2000 up 14.0%, 15.7% and 10.7%, respectively. S
Jesse Pichel, ROTH Capital Partners
October 2017: Is a solar winter coming?
Stock price index:Brace yourself: Section 201 is coming. This was the theme at SPI, where investors could only speculate on how the Suniva petition may play out.
There was certainly no summer lull for the global solar industry over August. Despite this traditionally being a time of quiet reflection on H1, and a recharging of batteries as the sector gears up for the fun and games of the third quarter, there was plenty to keep market watchers busy all summer long. But before we get to that, let us look first at how the stocks performed.
Last month (between the period of August 14 and September 12), solar stocks slightly underperformed the U.S. broader market. The Guggenheim Solar ETF (TAN) gained +1.7% compared to the S&P 500, Dow, and Russell 2000, which gained +2.3%, +1.2% and +3.6%, respectively.
Many PV equipment companies continue to trade higher as new solar module technologies are driving the capex upgrade cycle currently underway for PERC (passivated emitter rear contact) cell technology and PERT (passivated emitter rear totally diffused) cell technology. Polysilicon companies also performed well last month, primarily due to the substantial increase in spot prices driven by higher demand for solar modules in China.
The noise around the Section 201 petition in the U.S. was the dominant topic at last month’s Solar Power International (SPI) exhibition in Las Vegas. The petition’s outcome may not be fully reflected in current stock prices, but we at ROTH Capital Partners would expect stock volatility to increase as the decision date looms closer.
The threat of Section 201 sparking the introduction of module tariffs has caused sold-out conditions for modules in the U.S. as the industry increases inventory. Investors attending the SPI conference are focused on how the Section 201 tariff may impact 2018+ demand volume and margin profile of companies, and if the current pull-in of module demand will create an air pocket of module demand in 2018, even under a modest tariff outcome.
Jesse Pichel, ROTH Capital Partners
September 2017: A case for optimism
Stock price index: In May and June, performance of the Guggenheim Solar ETF was remarkable. Now, gains achieved over the past four weeks are stunning.
Since May 2017, the Guggenheim Solar ETF (TAN) has outperformed the broader markets, having gained almost +35% year-to-date compared to the S&P 500 and Russell 2000, which gained +11% and +4% respectively. Index heavyweights such as JinkoSolar Holding Co., Ltd. and Sino-American Silicon Products Inc. gained in excess of 40% in a month, raising their respective market capitalizations in the ballpark of $1bn each. In fact, all 25 stocks that are comprised in the Guggenheim Solar ETF showed a positive share price performance over the past month. This unequivocally strong share price performance, particularly ahead of the decision of the U.S. International Trade Commission (ITC) on the Section 201 trade case brought forward by Suniva and SolarWorld Americas, which is due by September 22, does come as something of a surprise.
With both sides having released their respective reports ahead of the first hearing with the ITC (scheduled for the middle of August) it is still completely uncertain what recommendation the trade body will make to president Trump by November 13.
Yet the strong share price performance over the past three months clearly signals that investors are confident that no matter what the outcome of the Section 201 trade case, there is no stopping the growth perspective of the solar industry.
Moreover, it appears that hopes are high that the price increases for photovoltaic components seen in the market in the past few months are not only of temporary duration, but will enable manufacturers across the different stages of the value chain to sustainably improve their profit margins.
The financial reporting season for the solar companies, which began in the first week of August, will give a first hint at this – provided the expectations of the investors prove not to be overly optimistic.
Jesse Pichel, ROTH Capital Partners
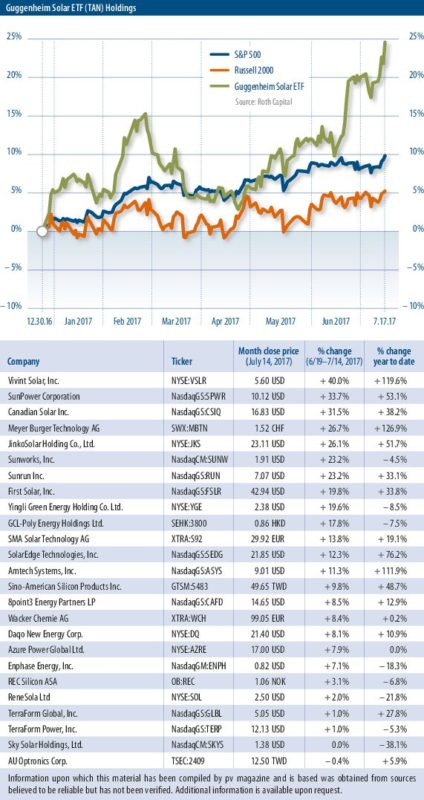
August 2017: An end to profitless prosperity?
Stock price index:Solar, like talk, is cheap. At least that was the message from Intersolar North America. But storage and PERC technologies look increasingly like good bets for reinvigorating the finances of the sector.
Within five minutes of attending Intersolar North America, it became evident that the industry was in a supply shortage. The Section 201 case has created pull-in demand for modules. Developers and EPCs are choosing to stock up on panels rather than risk higher-priced modules in the future. All of the top vendors we met are fully allocated for U.S.-compliant capacity, and mono high efficiency only exists in limited quantities while capacity ramps. Despite the pull-in, China continues to do better than expected, and pockets of strength remain in Southeast Asia and South America.
After nearly 30 meetings at the show, our biggest takeaway was that solar generation costs are, for the first time, below transmission and distribution costs – a key topic of the keynote from Eicke Weber. The adoption of storage is likely to grow as quickly or even more quickly than the adoption of solar. There may be higher technology barriers to entry on batteries allowing energy storage vendors to achieve better margins than the profitless prosperity of the solar module vendors. Last month, solar stocks significantly outperformed the U.S. broader market. The Guggenheim Solar ETF (TAN) gained + 12.5% compared to the S&P 500, Dow and Russell 2000, which gained + 1.1%, + 1.2% and + 1.6%, respectively. Residential solar companies were this month’s top gainers due to favorable net metering policies. Last month, Nevada Governor Brian Sandoval signed Assembly Bill 405, which reinstates net metering rates for rooftop solar customers. This erases the shadow of the state’s 2015 decision to end retail net metering. Equipment companies, which were last month’s top gainers, continue to trade higher as new module technologies are driving the capex upgrade cycle underway for PERC and PERT. Inverter companies also continue to gain as Huawei’s residential optimizer product remains late. Huawei’s product was expected to be released in Q3 2016 with a ramp-up in Q1 and Q2 this year, but is now expected to launch at SPI in September with a ramp-up in Q1 and Q2 2018.
Jesse Pichel, ROTH Capital Partners
July 2017: The tides of the heavyweights
Stock price index:The feared H2 slowdown in China may not be as drastic as anticipated, and regressive U.S. policy cannot halt the march of solar.
For the last four week period covered in this column (May 15 to June 12), solar stocks outperformed the U.S. broader index. The Guggenheim Solar ETF (TAN) gained +1.9% compared to the S&P 500 (+1.6%), Dow Jones (+1.6%), and Russell 2000 (+2.6%). In the preceding month (April 17 to May 12) the TAN gained +4.8% compared to the S&P 500 (+2.7%), Dow Jones (+2.2%), and Russell 2000 (+2.8%). Solar stocks have been on the rise given that the expected second half demand in China may not be as weak as previously expected, as well as the fact that there is a technology upgrade cycle underway that may weed out obsolete capacity. The top gainers were solar equipment companies. Investor interest in solar equipment companies is high given the capex upgrade cycle underway for PERC and PERT. This comes on the heels of the discussion around the Top Runner program in China, in which the National Energy Administration (NEA) has higher efficiency requirements for multi and mono. The largest declines were upstream companies on the back of the Section 201.
Despite outrage from the cleantech community, the U.S. withdrawal from the Paris climate accord did not have any effect on solar stocks. Since the news, the Guggenheim Solar ETF gained ~1% (as of June 13, 2017). Despite the ebb and flow of U.S. and global policy, the technology improvements and resulting cost down of solar, wind, and storage is unstoppable and thus green and sustainable electrons will soon be the lowest cost energy source. With technology out of the box, the debate should revolve around how best to monetize a new energy economy. Lowering corporate tax rates to spur manufacturing, settling inefficient trade disputes, and focusing on U.S. job creation can be something all can agree on. Also, despite the U.S. lack of support for Paris, several states have already adopted carbon reduction targets, and companies recognize that eco is good business.
June 2017: A tumultuous time
 Stock price index: The insolvency filing of SolarWorld may have grabbed most of the headlines, but the past four weeks also saw the downfall of Suniva and Ten K Solar. Meanwhile, PERC’s onward march means good business for plenty of solar equipment providers.
Over the course of the last four-week period (dating between April 17 and May 12), solar stocks have outperformed the U.S. broader index. The Guggenheim Solar ETF (TAN) gained +4.8% compared to the S&P 500 (+2.7%), Dow Jones (+2.2%) and Russell 2000 (+2.8%).
This month’s top gainer is a solar equipment company, coming off a large follow-on equipment order. Right now, investor interest in solar equipment companies is high, given the Capital expenditure cycle underway for PERC (Passivated Emitter Rear Contact) cell technology and PERT (Passivated Emitter Rear Totally Diffused) technology, with new lines and upgrades of existing lines keeping companies busy. The potential Section 201 in the U.S. may also bring about new cell manufacturing lines.
This month’s second largest gainer on the Guggenheim Solar ETF is a U.S.-based thin film CdTe solar module company that is in a position to benefit from the aforementioned section 201 petition, due to the fact that thin-film modules are not included in the trade case that was brought by the now insolvent (see below) Suniva. However, the second-largest gainer for the month also beat its Q1 2017 earnings and increased its 2017 guidance.
The third and fourth largest gainers were both polysilicon companies, growing on the heels of increased poly average selling prices in the near-term. One of the polysilicon companies has also issued a strong second quarter 2017 guidance.
Three solar companies went bankrupt last month. SolarWorld, which is down 60.9% in the month, and Suniva, blamed Chinese producers of the practice of dumping cheap solar panels into the U.S. market for its downfall. Ten K Solar, meanwhile also announced plans to restructure and was exploring the possibility of liquidation.
Jesse Pichel, ROTH Capital Partners
May 2017: Positive rumblings
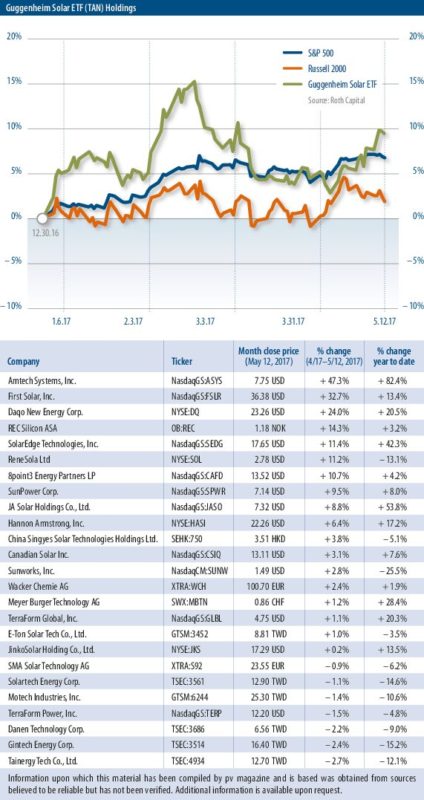 Stock price index:The largest stock gainers in April were module companies, while SNEC offered promise of larger market share for tier-1 suppliers.
In April, solar underperformed the U.S. broader market, in a second consecutive down month for the sector. The Guggenheim Solar ETF (TAN) declined 0.1% in April, compared to + 4.3%, + 8.5%, – 7.6% in January, February, and March, respectively. For comparison, the S&P 500, Dow Jones, and Russell 2000 gained + 0.5%, + 0.5%, and + 0.9% in April, respectively.
Module companies were April’s largest PV stock gainers, compared to being the largest decliners in March. With possible section 201 tariffs, module average selling prices (ASPs) may increase in the near-term as U.S. developers stockpile module inventory, which could result in better-than-expected earnings for non-U.S.-based module suppliers. Taiwanese cell and wafer companies accounted for April’s largest PV stock declines.
After investor meetings at the SNEC PV Power Expo in Shanghai, our observations from the event are as follows:
The new section 201 case being brought by Suniva is likely to create uncertainty, and Chinese OEMs may announce new manufacturing capacity in the U.S. as a result. CdTe technology is likely not included in the case, and could benefit.
While second half 2017 global PV demand will likely be lower, OEMs are more strongly positioned this cycle with better inventory management. Production has already been reduced beginning in the fourth quarter of 2016, and many OEMs are shifting capacity to higher efficiency and higher ASP PERC technology where demand is more pronounced. As a result, negative gross margins and inventory write-downs experienced in prior cycles are not widely expected by industry CFOs.
Tier-1 suppliers are likely to gain share given stronger balance sheets that allow a faster transition to higher efficiency. OEMs without higher efficiency are going to get left behind. Equipment companies leveraged to PERC and to a lesser extent passivated emitter rear totally diffused (PERT) will benefit.
Jesse Pichel, ROTH Capital Partners
October 2016: Solar stocks still slipping
Guggenheim Solar Index: Solar stocks are significantly underperforming the market, with fears over Trump’s likely move away from renewable energy adding to wider uncertainty.
The Guggenheim Solar ETF (TAN) fell (14.3%) this month [October 17 – November 18] compared to the S&P 500 (+2.3%), Dow Jones (+4.0%) and Russell 2000 (8.5%).
With Donald Trump as the U.S. President-elect, a stock market crash that many feared was avoided. On the contrary, the U.S. broader market saw record performance post election. In the week of the election [week of 11/7], the Dow Jones and Russell 2000 posted its best weekly performance since 2011 and the S&P 500 posted its best weekly performance since 2014.
The solar sector, on the other hand, has trended downwards, given Trump’s fossil fuel agenda and denial of climate change, as the sector reported weak earnings this season. Approximately 71% of the cleantech companies in ROTH’s cleantech coverage either missed earnings or provided a weak outlook. Reasons for the wide-scale cleantech miss are as follows: 1) the macro economy is far from robust; 2) expected interest rate increases may be curtailing investments; 3) Trump’s outlook for energy policy is unclear; and 4) for solar in particular, there is a lull in project demand in the U.S. due to the perceived ITC cliff that everyone expected.
A green fuel source is inherently worth more to the U.S. than fossil fuel. These sources of energy and efficiency technologies are in many cases cheaper than fossils, have steep cost curves, produce a positive ROI for businesses and consumers, are anti-inflationary because they don’t use a commodity fuel or consume less fuel, have the ability to decentralize and stabilize energy supply. Lastly, regardless of a climate change debate, green energy and efficiency saves U.S. lives and lowers heathcare costs from pollution-related
illnesses. These advanced energy technology efforts may create a new decarbonized economy growth engine for jobs for decades, and technologies that can be marketed abroad to developing nations that are energy and carbon intensive.
Jesse Pichel, ROTH Capital Partners
September 2016: Solar stocks suffer
Guggenheim Solar Index: Uncertain times: Solar stocks continue to underperform, with inverter makers feeling the pressure from China. The broader market is slowed by U.S. election fears.
Solar stocks and the broader market have been down for three straight months as October ends. This is the first time in five years that the broader market has been down for three months running. With investors uncertain ahead of the U.S. election, fears of volatility and con-cerns over rising interest rates continue to weigh down in a risk averse environ-ment. In October, solar stocks were down -6.0%, compared to -2.9% in September and -2.4% in August. For comparison, the S&P 500 was down -1.9% in October, -0.1% in September and -0.1% in August. The Dow Jones was down -0.9% in Octo-ber, -0.5% in September, and -0.2% in August. Solar stocks have significantly underperformed the broader market YTD. Solar stocks are down -37.7% YTD compared to positive gains from the S&P500 at 4.0% and Dow Jones at 4.1%.
New data from Hedge Fund Research (HFR) show that hedge funds suffered $28 billion of net outflows in Q3 2016. This is the fourth consecutive quarter in which investors have pulled money out of hedge funds, and is the highest level since Q2 2009. In October, we saw the first solar IPO since August 2015. Azure Power (AZRE), an independent power producer (IPP) in India, raised approxi-mately $136.4 million in its IPO and con-current private placement. As of Octo-ber 31, AZRE is down -11.4% from its IPO price of $18. Inverter companies led the majority of the declines this month as these companies experienced pricing pressure from new Chinese entrants into the U.S. markets.
The majority of upstream solar compa-nies experienced positive gains through October as prices begin to stabilize after an inventory sell-off in September. This comes on the heels of a pushback in Chi-na’s feed-in-tariff cuts for solar projects registered by year end 2016 to be oper-ational by September 30, 2017, which caused the H1 installations rush to slow down. This will ease investor concerns to H2 2017 instead of 2016.
Author: Jesse Pichel, ROTH Capital Partners
August 2016: An American tale
Guggenheim Solar Index: Takeaways from SPI:At SPI last month, the 4th Annual ROTH Solar and Storage Symposium met with the solar supply chain. Here are five takeaways from that event.
Takeaway 1: Storage is the star of the show. Storage is viewed as a way for solar to increase penetration worldwide. As the European storage industry surges on energy arbitrage, the U.S. storage indus-try has not reached significant scale. Lower cost batteries will be required for the industry to grow in the U.S. and var-ious chemistry vendors are working a steep cost curve.
Takeaway 2: Utilization of upstream solar suppliers is fading. The policy shift in China followed by reduced demand in Japan and pushouts in North America are the culprits. Companies report utili-zation in the 60-70% range, while those that keep factories at 100% capacity rap-idly lower prices, which creates a most difficult pricing environment. The lower prices that have resulted from the slow-down in China have caused North Amer-ican developers to push out projects until 2017 to take advantage of better pricing.
Takeaway 3: Price Discovery. Many leading vendors presented an out-look that module prices in the U.S. are expected to hit $0.40-0.43/W in 4Q2016, with a possibility to reach $0.35/W by year end 2017. Several module vendors have a cost of $0.35/W today and have a targeted sub-$0.30/W by year end 2017.
Takeaway 4: The residential solar market has moderated in the U.S. The U.S. residential solar market has seen growth rates decline as it reaches higher levels of penetration. Most vendors see 20% growth scenarios, although some anticipate flat to down. We also see the continued shift away from leases to loans and PACE financing.
Takeaway 5: Despite the solar indus-try downturn, capacity keeps rising from China. Relatively unknown or new module players in China have raised a substantial amount of money and are building out capacity. A-share listed companies in China trade at a signifi-cant premium to U.S. or European listed companies. As a result, more privatiza-tions can be expected.
Author: Jesse Pichel, ROTH Capital Partners
July 2016: Caution in the air
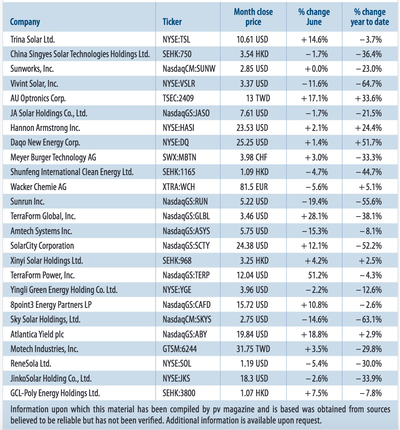
Guggenheim Solar Index: Anticipated slowdown in the Chinese solar market, post-peak years on the cards for Japan, and with many U.S. developers viewing the ITC extension as something of a breathing space, solar stocks have begun to slide despite overall global growth in the industry.
Solar stocks had significantly underperformed the broader market by mid-August due to poor earnings and a bleak outlook from solar bellwethers. This weakness was well anticipated given the commentary emanating from the large summer solar exhibitions, namely SNEC and Intersolar Munich/SF. China H2 16 is down significantly from H1 16, Japan will slowly decline over the next few years from last year’s peak, and the U.S. will experience a project lull for 2017 and 2018. Additionally, development/project capital and investor appetite for solar stocks in the U.S. remains weak behind the slow-motion train wreck of SunEdison. We fear that the SunEdison debacle may thwart investments in the downstream sector similar to the way the Solyndra and Suntech bankruptcies thwarted investments in the cell/module sector. Further, the SolarCity acquisition by Tesla is widely considered from a position of weakness, not a position of strength.
Solar stocks declined -0.8% this past month [July 11 – August 10] compared to positive gains of +3.8% in the prior month [June 13 – July 8]. The S&P 500, Dow and Russell 2000 gained +2.1%, +1.9% and +3.9%, respectively this month, compared to +1.6%, +1.6% and +1.2% in the prior month.
This month’s largest gainer is a Chinese solar module company that announced it has entered into a definitive agreement for its going private transaction. The merger consideration represented a 21.5% premium to its closing price on the last trading day prior to its announcement of receipt of a “going-private” proposal, and a premium of 40.6% to the closing price on the last trading day prior to the definitive agreement announcement.
Solar module/upstream companies led the majority of the declines for the second straight month. This month’s top decline is a U.S. solar panel manufacturer that reported solid Q2 16 results, but lowered its 2016 guidance due to decreased demand for utility-scale solar projects and lower panel prices. The company’s stock declined -30.2% on the news, which also dragged down many of its peers. On average, solar module companies are down -36.3% year-to-date. Given the threat of overcapacity, solar cell/module average selling prices (ASPs) are expected to decline, which will squeeze margins and earnings. Despite the slowdown of solar demand in 2017, global solar installations are expected to grow 43% this year to 73 GW compared to 55 GW in 2015, according to Greentech Media’s latest report.
As the solar industry embraces for overcapacity, companies that are not exposed to the solar upstream ecosystem are expected to prosper. This month’s third-largest gainer is a U.S. residential and commercial solar installer that is technology and manufacture agnostic, which allows the company to benefit from the decline in solar module costs. The company reported record Q2 16 revenues and raised its full-year revenue guidance by 10-15%.
Energy storage continues to remain a hot sector. Last month, U.S. senators introduced a new bipartisan energy storage bill that would establish subsidies for residential and commercial energy storage deployments designed to help accelerate energy storage deployments in the U.S. The new Bill is modeled after the current 30% U.S. solar investment tax credit (ITC), which has helped the solar industry grow at a compound annual growth rate (CAGR) of 76% since the ITC was implemented in 2006.
Author: Jesse Pichel, ROTH Capital Partners
June 2016: Brexit bounce-back
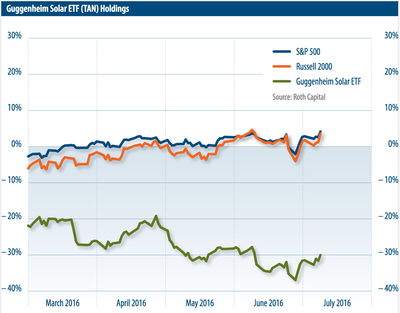
Guggenheim Solar Index: The broader stock market has been on the rise since mid-July despite the Brexit scare pushing market and solar stocks down. Recovery was swift, and for the U.K.’s energy sector in particular it is not all doom-and-gloom.
By mid-July broader stock market has been on the rise despite the Brexit scare that sent the market down ~5% and solar stocks down ~7%. Stocks have now recovered from post-Brexit lows as the S&P 500 set a new all-time high on July 11 based on 1) eased Brexit fears and 2) a Blockbuster June jobs report that signaled growth in the U.S. economy. Solar stocks, which outperformed the broader market this month, gained 3.8% compared to 1.6% in the month prior thanks to positive gains from renewable IPPs and yieldcos. For comparison, the S&P 500, Russell 2000 and Dow gained 1.6%, 1.2% and 1.6%, respectively, compared to 2.4%, 5.6% and 1.9% in the previous month.
This month’s top three performing stocks were renewable IPPs and yieldcos. One of the yieldco’s stock spiked 18% after Canada’s largest alternative asset manager unveiled an activist stake in the company, which made it the top gainer. Its sister yieldco, which shares the same bankrupt parent company, was the second largest gainer this month. There were two other positive developments for IPPs and yieldcos this month; 1) a large Danish wind IPP went public in Europe, the largest European IPO of 2016; and 2) a Canadian renewable yieldco (subsidiary of Canada’s largest alternative asset manager) raised CAN$800 million in an equity offering. Also, in light of continued low interest rates, investors are searching for yield.
Solar module/upstream companies led the majority of the declines given the threat of overcapacity in H2 2016 in China. As PV demand in China eases, this will lead to the decline of ASPs. In early June, China's NEA announced that it may revise its 2020 solar target from 150 GW to 110 GW.
While the consensus is that Brexit is a negative for the U.K. renewable market in the near term, the longer term impact is more uncertain. It is unlikely Brexit will alter the U.S. and EU charge towards renewable energy. Near term, it will take two years for the Brexit process to run its course. In the meantime, the volatility and drop in the British pound makes overseas ownership of U.K.-based projects less attractive. PV panels, inverters and other infrastructure projects in the U.K. are purchased in Euros, and debt providers and project buyers (many from Germany) will take a pause given the currency drop and less attractive yields. Projects may be stranded, or at least paused indefinitely.
Longer term, EU 2020 targets for the U.K. are also called into question, and the country has consistently reversed from its support for solar with severe subsidy cuts. The U.K. remains a global leader in offshore wind, but it is reported that much of that is funded by EU nations such as Germany. Ironically, the largest threat to U.K.-based solar and wind may have been the planned EU intercontinental transmission lines to renewable-rich Scandinavia and Northern Europe, which would lower the high wholesale energy rates in the U.K. If a transmission network is stalled, wholesale electricity rates may remain high, but in turn would make U.K.-based solar installations more competitive since solar project PPA rates under the
Renewable Obligation Certificates revert to wholesale rates after 10-15 years. The reversion to wholesale rates had been an ongoing negative for project buyers that anticipated a drop in wholesale rates. Also, EU duties on imported solar panels would be removed, thus making the panels less expensive. Additionally, it is reported that while removal of EU requirements/regulations may make it easier to develop renewable infrastructure in the U.K., there may be no strong incentive to make that happen, other than high fossil energy prices. And since the EU has no formal free trade agreement with the fast growing India market, it is thought that the U.K. may be in a better position to negotiate a free trade agreement with this market.
Author: Jesse Pichel, ROTH Capital Partners
May 2016: Caution in the winds
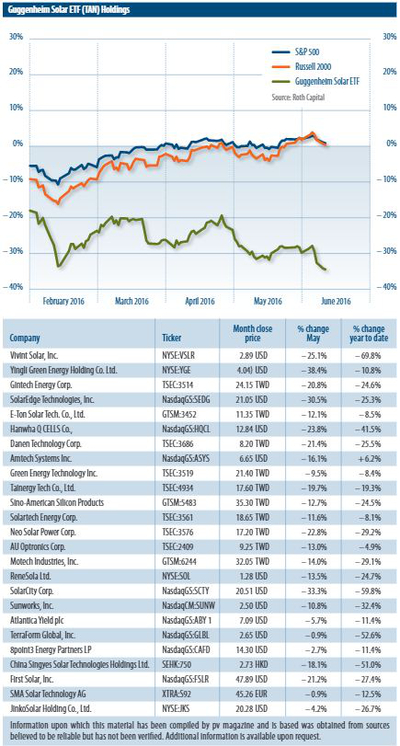
Guggenheim Solar Index: Fears of a Brexit stalk the global economy, but an impending China FIT deadline and brisk activity in storage keep spirits high.
At the time of going to press, the broader stock market has been on the rise fueled by 1) unchanged interest rates by the U.S. Fed at its June meeting; 2) lowered projections of how much the U.S. Fed will raise short-term interest rates in the coming years, and 3) higher oil prices due to production disruptions in Nigeria, Venezuela, Libya and Canada. However, investors remain cautious on a Brexit (British exit) as the U.K. faces an In/Out referendum on the EU on June 23, which could negatively impact the global economy.
Taiwanese upstream solar companies were this month’s top gainers due to increased demand as downstream companies rush to install projects ahead of the China FIT deadline of June 30. Polysilicon manufacturers weighed down the sector after months in positive territory. Polysilicon price quotes have been on the rise recently due to the China FIT installation deadline and as the ongoing China-U.S. trade dispute continues to keep U.S. polysilicon manufacturers out of China. However, there is indication that polysilicon prices may be modestly falling as buyers anticipate a glut.
Energy storage companies continue to attract interest as a need for grid optimization and increased regulatory policies drive the space. In June, Europe’s largest manufacturer of residential energy storage systems secured an investment from a large multinational conglomerate to support its continued international growth. There were also two energy storage acquisitions in May.
The first acquisition of note was a French specialty battery manufacturer, and the second acquisition was an intelligent customer-sited energy storage solution that can help commercial customers control rising demand charges. According to the Energy Storage Association, the U.S energy storage market will grow from a relatively modest $134 million in 2014 to $2 billion by 2020, with the behind-the-meter sector expected to surpass the utility sector in 2019.
Author: Jesse Pichel, ROTH Capital Partners
April 2016: Solar stocks buck growth trend
Geggenheim Solar Index: Energy storage companies and polysilicon producers represent the strong performers, as U.S. solar bellwethers face structural challenges.
In May, the broader stock market experienced three straight months of positive gains. The S&P 500, Dow and Russell 2000 gained +1.5%, +0.1% and +2.1%
respectively, compared to +2.6%, +2.1% and +1.7% in April and +6.6%, +7.1% and +7.7% in March.
Solar stocks, on the other hand, underperformed this month due to lackluster earnings from solar bellwethers with exposure to the U.S. residential solar market as installation growth is expected to slow. Lower growth from residential solar bellwethers reflect the impact of negative policy decisions (Nevada) combined with a decision to eliminate the more costly customer acquisition sources in a capital constrained environment. One solar company exposed to the U.S. residential solar market almost ended the month as one of the top declines in May, but after it closed a tax equity investment fund with a new investor and an analyst upgrade late in the month (May 27), the stock popped to make it May’s second largest U.S. gainer. The Company’s competitor completed its first cash equity transaction earlier in May, but ended the month as the worst performer.
Taiwanese upstream solar companies (ingots, wafers, cells) were this month’s top gainers due to increased demand as downstream solar companies rush to install projects ahead of the China feed-in-tariff (FiT) installation deadline of June 30, 2016. Polysilicon manufacturers also continue to perform above the average of its solar industry peers.
Global demand for solar modules also continues to remain strong even as demand in China is forecast to slow in 2H16. According to public reports, tier-1 module companies guided to a strong 2Q16 and reiterated 2016 full year shipment guidance. Energy storage companies have attracted interest from large global conglomerates with two major acquisitions in May. According to Energy Storage Association, the U.S energy storage market will grow to $2 billion by 2020.
Author: Jesse Pichel, ROTH Capital Partners
February 2016: Stocks on the mend
Guggenheim Solar Index: After a rough start to 2016, solar stocks are now showing encouraging signs of stability, particularly in the important U.S. market.
The global stock market has been on the mend since mid-February. Fears of a 2016 global recession have been somewhat alleviated, and the most worrisome con-cerns surrounding China are beginning to fade. As we write this column in mid-March, U.S. stocks posted gains for three consecutive weeks since February 15 on widespread short-covering, with the S&P 500 up +2.8%, +1.6% and +2.7% in each of the past three weeks. For comparison, the Russell 2000 gained +3.4%, +2.1% and +3.7% and the Guggenheim Solar ETF (TAN) gained +7.0%, +5.7% and +4.3%. Oil prices have also posted gains for four consecutive weeks since February 8, with the WTI Crude up 3.3%, 3.2%, 4.2% and 10.8% in each of the past four weeks, which also bodes well for the cleantech/solar sector overall. Global demand for PV modules continues to remain strong. Based on public company reports, there is good demand visibility through 1H16, yet some uncertainty in 2H16 given pol-icy changes in China and some market and policy uncertainty in Japan. The U.S. remains quite strong on the heels of its recent ITC extension. Several tier-1 mod-ule manufacturers raised guidance, yet two manufacturers indicated caution on risks of overcapacity and pricing pressure in 2H16.
There are two issues in China that are driving concern: 1) China has not paid its FIT on solar projects for ~2 years; this is prompting investors to question how long the delays can stretch for before it negatively impacts demand; and 2) China extended its installation cutoff date from December 31, 2015 to June 30, 2016. This sets up a strong 1H16 and a potential weak 2H16. New Chinese permit requirements starting in 2H16 have not been issued.
On another note, the state of Massachu-setts has been on investors’ radar as the SREC for residential solar installations will soon expire. The publicly traded U.S. residential solar companies exposed to the Massachusetts residential market have been in decline since the news broke.
January 2016: US firms drive index lower
NYSE Bloomberg Solar Energy Index: SunEdison restructures and net metering battles wage on as the U.S. solar industry shapes the global index.
The NYSE Bloomberg Solar Index plum-meted in January after a short-lived bounce in December. The index gave up 21% as investors eyed SunEdison’s restruc-turing saga and various macro headlines. The decline began early in the month after SunEdison announced that it had arranged two new loans and issued new shares to pay off a portion of its debt. The index saw more pressure later in the month as the Califor-nia and Nevada public utility commissions continued to escalate the net metering bat-tle. Nevada moved to lower the remunera-tion for net metering, and California utili-ties moved to appeal the decision to keep net metering rates steady. Throughout the month, the backdrop of low and falling oil prices continued to cast a shadow on inves-tor sentiment.
Each month, we examine the drivers of solar stock performance for the heavy-weight components across geographies in the index. During the month of January, many Asian-traded constituents pulled down the index. For example, GCL Poly-silicon traded down 15% after issuing $225 million of convertible bonds on the Singapore Stock Exchange.
On the European exchanges, SMA Solar gave up 14% after several months of strong performances. The company traded down despite exceeding sales and earnings guidance for 2015 according to provisional figures. Meyer Burger was down 4% after releasing unaudited finan-cial data for fiscal year 2015.
Heavyweights on the U.S. exchanges were the main drag on the index dur-ing January, driven by the SunEdison restructuring and public utility com-mission battles. First Solar bucked the trend, finishing up 4% after receiving a key upgrade from Goldman Sachs. Solar-City slid 30% after pulling out of Nevada and eliminating 550 jobs after the public utility commission terminated its roof-top solar policy. SunEdison fell 39% after announcing restructuring efforts as a key shareholder initiated a lawsuit to block the Vivint acquisition.
Author: Adam Krop, The Trout Group LLC
December 2015: Adulation and undulation
NYSE Bloomberg Solar Energy Index: COP21 and extension of US Investment Tax Credit drive index higher; optimism offset by FIT cuts in China and possible renewal of EU import tariffs.
The NYSE Bloomberg Solar Index bounced off lows in December after looking for direction in November. The index finished up 6% thanks to several positive developments throughout the month. Early in the month, the index received support from the COP 21 conference in Paris, which set goals to reduce carbon emissions by 20% in Organization for Economic Co-operation and Development (OECD) countries. Later in the month, U.S.-traded stocks received a boost from the extension of the solar Investment Tax Credit (ITC) in a surprise move for the industry. During the same time, the California Public Utility Commission rejected a net metering rate increase, considered a key hurdle in the adoption of solar. The index performance was offset by trading activity in most Chinese entities, which lagged as rumblings of the domestic FIT cut was more than expected and more chatter about a renewal of EU tariffs on Chinese-produced components.
Each month, we examine the drivers of solar stock performance for the heavyweight components across geographies in the index. During the month of December, Asian-traded constituents offset the optimism in U.S.-traded names. GCL Polysilicon traded down 15% after executing a rights offering. Sungrow, Chinese inverter manufacturer, gave up 3% on the industry headlines in its domestic market.
On the European exchanges, SMA Solar added another 13% on strong 3Q15 results, including robust sales growth and positive operating income, and confirmed increased 2015 guidance. Capital Stage AG fell 9% on declining subsidies in the UK and yieldco uncertainty in the U.S. REC Silicon slid 12% as polysilicon pricing remained weak.
Heavyweights on the U.S. exchanges outperformed the index during December, driven by the positive headlines in the region. SolarCity spiked 77% after Congress passed the ITC extension. First Solar and SunPower soared 17% and 25% were also up on the ITC and net metering news.
Author: Adam Krop, The Trout Group LLC
November 2015: Searching for direction
NYSE Bloomberg Solar Energy Index: Index searches for direction as policy support offsets mixed 3Q15 reports and Paris Climate talks boost investor optimism.
The NYSE Bloomberg Solar Index searched for direction in November after a strong performance in October. The index ticked down 1% as several polarizing headlines drove trading in the sector. Early in the month, many U.S. stocks traded down after weak 3Q15 reports from SunEdison, TerraForm Power and Enphase Energy rattled the market. On the other hand, investor optimism began to build ahead of the UN Conference on Climate Change in Paris in late November/early December. In the weeks leading up to the conference, many countries and financial institutions revealed aggressive CO2 reduction targets and financing commitments to support a potential agreement.
Each month, we examine the drivers of solar stock performance for the heavyweight components across geographies in the index. During the month of November, Asian-traded constituents turned in mixed performances. GCL Polysilicon was down 9% after announcing a further delay in the disposal of its non-solar power business, despite solid 3Q15 results that highlighted strong demand in its domestic market. Sungrow, the Chinese inverter manufacturer, added 3% after announcing new contract wins in several markets.
On the European exchanges, SMA Solar added another 3% on strong 3Q15 results, including robust sales growth and positive operating income, and confirmed increased 2015 guidance. Capital Stage AG fell 2% in November on declining subsidies in the U.K. and yieldco uncertainty in the U.S. REC Silicon soared 29% as investors applauded insider buying despite job and production cuts across the organization.
Heavyweights on the U.S. exchanges underperformed the index during November. SunEdison and TerraForm Power were punished by investors, finishing the month down 56% and 62% after announcing a strategic shift to slow growth and focus on cash generating opportunities, while cutting headcount to rein in costs. First Solar and SunPower fell 1% and 11% in sympathy with SunEdison and its yieldcos.
Author: Adam Krop, The Trout Group LLC
October 2015: Global demand rebound
NYSE Bloomberg Solar Energy Index: Strong China volume growth and upward guidance from some U.S. heavyweights drive index bounce back.
The NYSE Bloomberg Solar Index bounced back 13% in October after five consecutive months of down performance. The positive performance was supported by 3Q15 reports from western heavyweights, including strong results at SunPower and First Solar late in the month. SolarCity, however, disappointed investors in its 3Q15 report and 4Q15 guidance. Headlines from China’s National Energy Administration (NEA) helped buoy Chinese constituents. The NEA indicated it expected solar installations to reach 150 GW by 2020, up from 36 GW in mid-2015. In addition, the NEA announced solar installations more than doubled in the first nine months of 2015 to 9.9 GW from 3.8 GW during the same period in 2014.
Each month, we examine the drivers of solar stock performance for the heavyweight components across geographies in the index. During the month of October, the vast majority of companies posted positive performances on strong market demand headlines. GCL Polysilicon was up 8% on implications that polysilicon prices will be supported by China’s decision to impose duties on polysilicon imports. Sungrow, the Chinese inverter manufacturer, was up 15% on strong demand in its domestic market and new orders in other Asian markets.
On the European exchanges, SMA Solar added another 12% as sales and volume momentum continued throughout the month. Bluefield Solar Income Fund and Foresight Solar Fund were up 4% and 2% in October despite evaporating subsidies in the U.K. and yieldco uncertainty in the U.S.
Heavyweights on the U.S. exchanges outperformed the index during October. First Solar soared 34% after reporting 3Q15 revenue and EPS ahead of expectations and raising 2015 guidance. Similarly, SunPower jumped 34% after beating 3Q15 estimates and raising 2015 EBITDA forecasts. On the other hand, SolarCity plunged 31% after reporting 3Q15 and guiding 4Q15 below Consensus. The Company stated it will focus on cost reduction and generating positive cash flows in 2016. Most Chinese ADSs outperformed the index on the strong growth headlines in China.
Author: Adam Krop, The Trout Group LLC
September 2015: Yieldco meltdown
NYSE Bloomberg Solar Energy Index: Investor sentiment sours on the yieldco model, pulling down index performance. Chinese constituents offset performance from western peers.
The NYSE Bloomberg Solar Index slid another 6% in September with the majority of U.S. traded stocks in the red. Constituents traded on Asian exchanges offset weak performances from their western peers. U.S.-traded stocks were weighed down by weakening investor sentiment in the yieldco group where investors were spooked by the combination of a flood of IPOs and secondary offerings as well as rising interest rate concerns. The ensuing decline in yieldco stock prices created increased dilution risk and brought growth assumptions into question at U.S. solar companies. However, the market turmoil was in stark contrast to industry anecdotes at the Solar Power International industry conference. There, sour investor sentiment was met with positive outlooks on demand in key markets, stable component pricing and ample project financing availability.
Every month, we examine the drivers of solar stock performance for the heavyweight components across geographies in the index. During the month of September, companies exposed to the yieldco model felt the most pressure, while most heavyweights traded on Asian exchanges played a supporting role for the index. GCL Polysilicon was up 20% after announcing the $502 million sale of its non-solar business. Sungrow, the Chinese inverter manufacturer, was up 25% on the back of strong demand in its domestic market.
On the European exchanges, SMA Solar continued to buck the trend, adding another 11% after raising its 2015 sales and earnings forecast again. Meyer Burger was down 21%, trading in sympathy with other western peers.
Heavyweights on the U.S. exchanges underperformed the index during September. First Solar and SunEdison were down 11% and 31% respectively on the yieldco uncertainty. SolarCity gave up 11% despite announcing a new $400m financing arrangement with an institutional investor. Sunpower was down 17% as investors evaluated growth assumptions in light of the yieldco crash. Most Chinese ADSs outperformed the index likely due to less exposure to the yieldco model.
Author: Adam Krop, The Trout Group LLC
August 2015: Entering negative territory
NYSE Bloomberg Solar Energy Index: Flagging economic growth in China and soft second quarter reports drive the largest monthly decline registered so far in 2015.
The NYSE Bloomberg Solar Index plummeted 17% in August, continuing the trend that started in April. Roughly 90% of index constituents were in the red as several macroeconomic themes weighed on stock prices. New concerns about economic growth in China pressured the index as factory output and asset investment came in below expectations for August. In addition, several solar project developers in China noted that they were receiving less than expected from industry regulator’s subsidy policies. In the U.K., regulators made another move to dramatically cut subsidy support to small-scale solar, which is expected to hamstring growth in that country. On the 2Q15 earnings front, certain industry bellwethers reported results below expectations, which created more drag on the index.
Every month, we examine the drivers of solar stock performance for the heavyweight components across geographies in the index. Heavyweights traded on Asian exchanges were weak after the disappointing economic growth metrics and some company specific concerns. Tianjin Zhonghuan Semiconductor tumbled 29% on the slowing economic growth headlines. GCL Polysilicon gave up 21% after reporting a drop in 2Q15 profits as polysilicon prices dipped. On the European exchanges, SMA Solar continued to buck the trend, adding another 17% after reporting strong 1H15 revenue growth and break-even EBIT expectations for full year 2015. Meyer Burger was down 6% despite improving 1H15 results versus the prior period and confirming 2015 financial targets.
The heavyweights on the U.S. exchanges largely turned in weak performances during the month. However, First Solar was in the minority with an 8% boost on a strong 2Q15 earnings performance and increased 2015 volume guidance. SunEdison cratered 55% after reporting higher than expected 2Q15 losses and increasingly aggressive debt levels. SolarCity fell 17%, erasing gains from the completion of its most recent securitization offering. The majority of Chinese ADSs were in the red, with Canadian Solar and Trina Solar down 30% and 7% respectively on the flagging economic growth in China.
Author: Adam Krop, The Trout Group LLC
July 2015: Downward trend continues
NYSE Bloomberg Solar Energy Index: Markets heading south amid China concerns and a flood of new capital. M&A and capital raising activity robust.
The NYSE Bloomberg Solar Index gave up another 11% in July as new concerns surfaced in China and numerous corporate capital raises flooded the market. Roughly two-thirds of index constituents were in the red. The Chinese market was again in the crosshairs after the National Energy Administration announced solar capacity was idled due to concerns of stability of the local power grids. In addition, Hanergy shares were officially suspended after an investigation into the disclosures of the company.
In Europe, the U.K. announced another cut to solar subsidies on the heels of a cut in April for installations that are greater than 5MW, creating more uncertainty in that market. Headlines from China, the U.S. and Japan continued to appear regarding pledges to curb greenhouse gas emissions prior to the December climate talks in Paris. Acquisition activity in the space was reported to reach a record high with several deals announced during the month as buyers focused on feeding project pipeline growth.
Solar stocks traded on Asian exchanges were weak after the NEA grid congestion announcement and some company specific concerns. Hanergy was officially suspended by the Hong Kong Securities and Futures Commission after an investigation into the disclosures of the company. GCL Polysilicon was down 12% after issuing $225m in convertible bonds. On the European exchanges, SMA Solar continued to outperform, jumping 49% after raising its revenue and EBIT forecast for the current fiscal year on strong demand in North America. REC Silicon was down 16% after missing 2Q15 estimates, cutting polysilicon capacity in Moses Lake and completing a private placement of shares.
The heavyweights on the US exchanges turned in mixed performances during the month. SunEdison fell 22% after more aggressive activity on the acquisition front, including the acquisition of Vivint Solar, Invenergy wind portfolio and the UK’s Mark Group; investors began to raise eyebrows on rising debt levels. SunPower was down 5% despite beating 2Q15 profit estimates and stronger than expected 3Q15 guidance. SolarCity bucked the trend, adding 8% after the announcement of another $124m proposed securitization. The majority of Chinese ADSs were in the red, with Canadian Solar and Trina Solar down 6% and 18% respectively on the NEA announcement referenced above.
Author: Adam Krop, The Trout Group LLC
June 2015: Continued pressure
NYSE Bloomberg Solar Energy Index: Hanergy halted, Yingli liquidity concerns and Japan moves to cut subsidies.
The NYSE Bloomberg Solar Index continued to struggle in June, falling 17% on headwinds in key Asian markets. Top weighted Hanergy was halted in May after being a target of a probe from Hong Kong regulators. Yingli Green Energy cast a pall on the China-based solar group as it contended with liquidity concerns and the potential for more stringent lending policy. Japan, one of the largest global solar markets, announced it will move to cut solar subsidies to boost support of other renewables. On the positive side, regulators in India and Australia advanced solar policy by identifying solar installation plans and goals. Despite mixed headlines, several downstream solar companies continued to assess the US IPO window as 8point3 Energy Partners went to market.
Solar stocks traded on Asian exchanges weighed on the index in June. Hanergy remained halted while the Hong Kong Securities and Futures Commission investigate the affairs of the company. GCL Polysilicon was down 14% after announcing a proposed new issue of bonds. On the European exchanges, companies rode the media buzz from Intersolar Europe in Munich. Meyer Burger Technology added another 8% on more new equipment orders during the month. SMA Solar continued on a path to recovery, adding 20% after announcing a partnership with Siemens and other innovations in new applications at Intersolar.
The major constituents traded on U.S. exchanges turned in lackluster performances during the month. SunEdison was flat as it continued a strong M&A campaign. First Solar was down 5%, despite achieving world record thin film module conversion efficiency and pricing its IPO for 8point3, a yieldco formed in conjunction with SunPower. SolarCity fell 11% on a quiet month for company-specific news flow. The majority of Chinese ADSs were in the red, with Canadian Solar and Trina Solar down 12% and 6%, respectively, after liquidity concerns from Yingli projected uncertainty on the near-term lending environment in China.
Author: Adam Krop, The Trout Group LLC
May 2015: Headwinds for China
NYSE Bloomberg Solar Energy Index: The Hanergy probe, GCL component pricing and Yingli going concern issue serves to fuel the decline.
The NYSE Bloomberg Solar Index gave up ground for the first time in 2015, falling 5% in the month of May. Top-weighted Hanergy was the main driver, plummeting after Hong Kong officials confirmed a formal investigation into the trading activity of the company. Yingli Green Energy also put pressure on the index after announcing “substantial doubt” to continue as a going concern in its 2014 20-F filing. Offsetting these headwinds, Southeast Asia stepped up on the policy front as Vietnam looked to adopt FITs, and Taiwan announced a goal to triple installed renewable capacity. In addition, SunEdison helped prop up the index after it announced plans to launch a second yieldco with an emerging markets focus.
Solar stocks traded on Asian exchanges weighed on the index in May. Top-weighted Hanergy Thin Film Power Group plummeted 46% (and $19 billion of market value) after Hong Kong officials announced a probe into the affairs of the company. GCL Polysilicon dipped 12% after reporting a weak pricing environment and inventory build in Q1 2015. On the European exchanges, Meyer Burger Technology climbed another 17% after announcing new equipment orders during the month. SMA Solar continued to recover, adding 24% after reporting stronger than expected Q1 2015 revenue and EBITDA.
The major constituents traded on U.S. exchanges turned in mixed performances during the month. SunEdison jumped 18% after solid Q1 2015 results and filing a registration statement for a second yieldco with an emerging markets focus. First Solar was down 17% after reporting Q1 2015 revenue below expectations as projects were held ahead of its proposed JV yieldco with Sunpower. SolarCity was flat after reporting in-line Q1 2015 results and new cash valuation metrics. The majority of Chinese ADSs were in the red, with Canadian Solar and Yingli Green Energy down 8% and 45% respectively after Yingli disclosed in its 20-F that there is “substantial doubt” that it will continue as a going concern.
Author: Adam Krop, The Trout Group LLC
April 2015: A healthy ride
NYSE Bloomberg Solar Energy Index: SolarCity’s energy storage launch augments investor interest, with 2015 volumes looking positive.
The NYSE Bloomberg Solar Index posted another positive performance in April, adding 9% in the period. As a solid 4Q14 earnings period wound down, the early reporting companies began to issue mixed 1Q15 results. Top-weighted Hanergy was again a contributor to the positive index performance, despite announcing plans for a new share issuance. On the policy front, Japan proposed a target of a 20% reduction in emissions by 2030 ahead of the June G7 summit in Germany. In addition, Latin American countries continued to support solar: Mexico set a national energy production target of 5% renewables by 2018 (below an initial draft goal of ~8%) and Brazil announced the establishment of a US$6.5b fund to finance wind and solar projects. The month was capped off with SolarCity’s launch of its energy storage offering Solar stocks traded on Asian exchanges were generally on the positive side and carried the index performance during the month. Top-weighted Hanergy Thin Film Power Group was up 3%. Tianjin Zhonghuan Semiconductor Co Ltd popped 49% after announcing a partnership with Apple and Sunpower to develop solar projects in China.
On the European exchanges, Meyer Burger Technology clawed back 8% after entering into a strategic collaboration with leading French research center, CEA to develop next generation HJT equipment and SmartWire Connection technology. SMA Solar bounced back 17% on minimal April news flow after several months of weak performance.
The major constituents traded on U.S. exchanges turned in mixed performances in April. SunEdison added 6% as it continued to execute on its project pipeline. First Solar was unchanged. SolarCity jumped 17% on the month on the back of its energy storage launch with the Tesla Powerwall battery pack. The majority of Chinese ADSs were in the black, with Canadian Solar and Trina Solar up 6% and 1% respectively.
Author: Adam Krop, The Trout Group LLC
March 2015: On the positive side
NYSE Bloomberg Solar Energy Index: Top-weighted Hanergy reports profitable 2014, carrying index higher.
The NYSE Bloomberg Solar Index rode a number of positive data points during the month of March and, as a result, finished up a substantial 23%. A solid 4Q14 earnings period wound down with two Chinese heavyweights issuing favorable 2015 outlooks. Top-weighted Hanergy put up another strong stock performance, but this time was backed up by a profitable 2014 earnings announcement. Demand headlines remained active: India issued bidding guidelines for 3 GW of solar projects, China’s NEA announced expectations of 18 GW of solar in 2015, Scandinavian countries boosted renewable energy targets, while Mexico pledged a 25% cut to its emissions. The month was capped off by the successful IPO of SolarEdge, a key module level power electronics (MLPE) player.
Solar stocks traded on Asian exchanges were generally on the positive side and carried the index performance during the month. Top-weighted Hanergy Thin Film Power Group popped another 54% after it reported a surge in 2014 net income on the sale of five solar projects in China. GCL Polysilicon added 10% after reporting a strong 2014 and forecasting a return to profitability in 2015. On the European exchanges, SMA Solar resumed a decline, falling 4% after reporting Q4 14 and confirming it will not return to profitability in 2015 as volumes continue to flag. Meyer Burger Technology gave up 14% on soft 2014 results, which included losses from the GT Advanced Technologies insolvency, and an ambitious break-even EBITDA outlook for 2015.
Most constituents traded on U.S. exchanges underperformed the index. SunEdison added 8% as it continued to execute on its project pipeline and expand its energy storage solutions. First Solar was unchanged after it announced the public filing of a registration statement for its yieldco, a limited partnership with SunPower. SolarCity was unchanged on the month despite expanding into new states and launching its microgrid product, GridLogic. The majority of Chinese ADSs were in the black on the updated NEA demand projections, with Canadian Solar and Trina Solar up 13% and 16% respectively.
Author: Adam Krop, The Trout Group LLC
This page was last updated on November 12, 2024.
