Platts, a division of McGraw-Hill, manages and operates the financial market for futures and options on energy derivative products worldwide. Although it provides subscription-based information on these markets, it also now offers a free online “explorer” tool for renewable energy pricing.
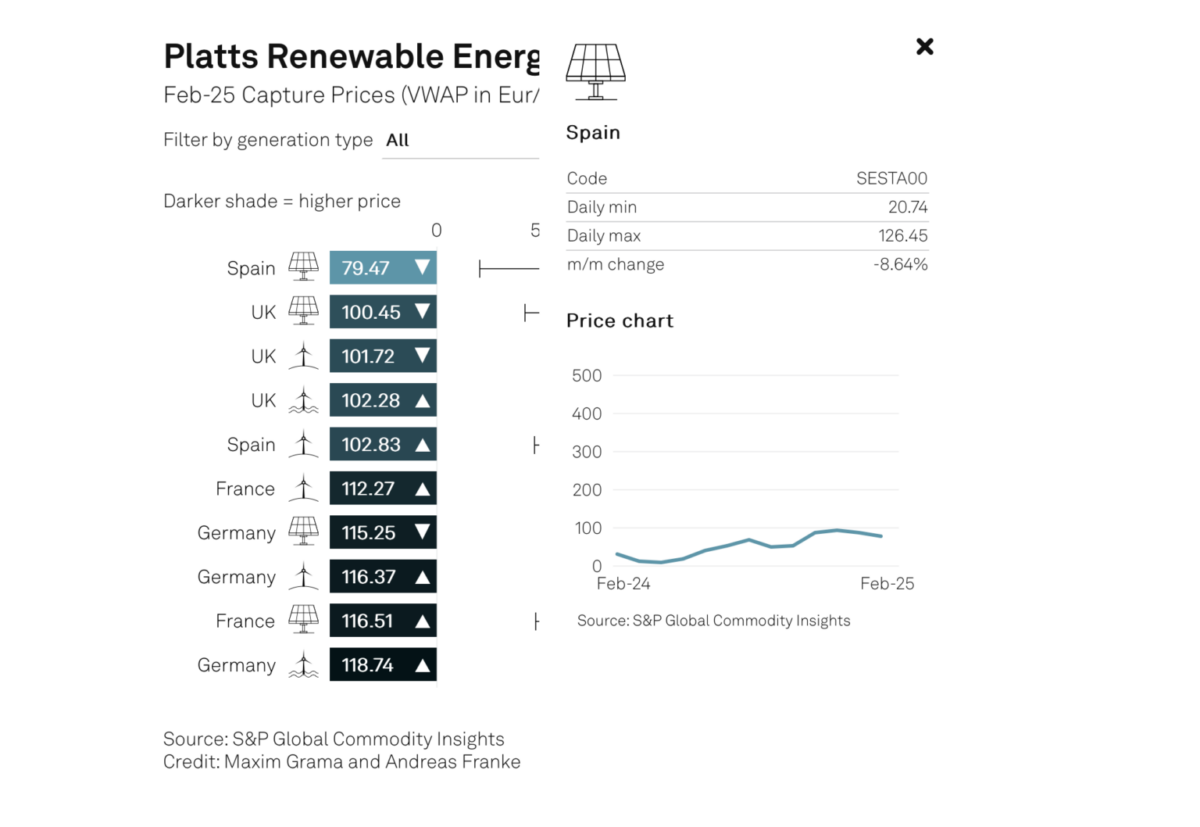
The tool displays the capture price received by wind and solar power assets using hourly production and monthly average price data for Spain, Germany, Italy, France, and the United Kingdom.
It includes a one-year graph showing daily minimum and maximum prices, along with the percentage difference between them.
A pie chart details each country's monthly generation mix, with installed capacity and generation data available by selecting individual countries.
This content is protected by copyright and may not be reused. If you want to cooperate with us and would like to reuse some of our content, please contact: editors@pv-magazine.com.


By submitting this form you agree to pv magazine using your data for the purposes of publishing your comment.
Your personal data will only be disclosed or otherwise transmitted to third parties for the purposes of spam filtering or if this is necessary for technical maintenance of the website. Any other transfer to third parties will not take place unless this is justified on the basis of applicable data protection regulations or if pv magazine is legally obliged to do so.
You may revoke this consent at any time with effect for the future, in which case your personal data will be deleted immediately. Otherwise, your data will be deleted if pv magazine has processed your request or the purpose of data storage is fulfilled.
Further information on data privacy can be found in our Data Protection Policy.