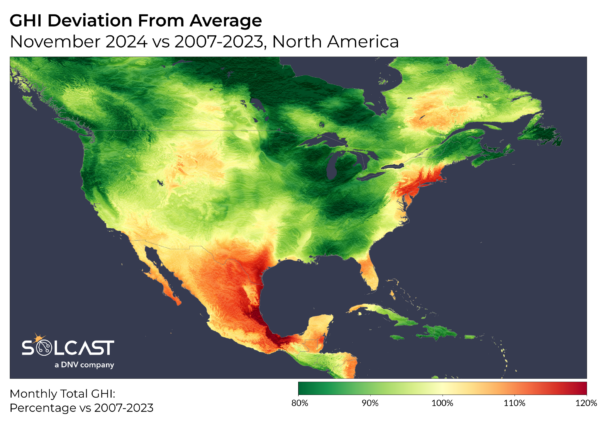
November proved challenging for solar energy across most of the US and Canada, as persistent cloud cover reduced solar irradiance, according to analysis using the Solcast API. Intense low-pressure systems over the Pacific and moist tropical air masses brought extensive cloud cover to much of the continent. While most regions saw irradiance fall well below average, southern Texas, Florida, and the northeast megalopolis stood out as rare bright spots, benefiting from clearer skies.

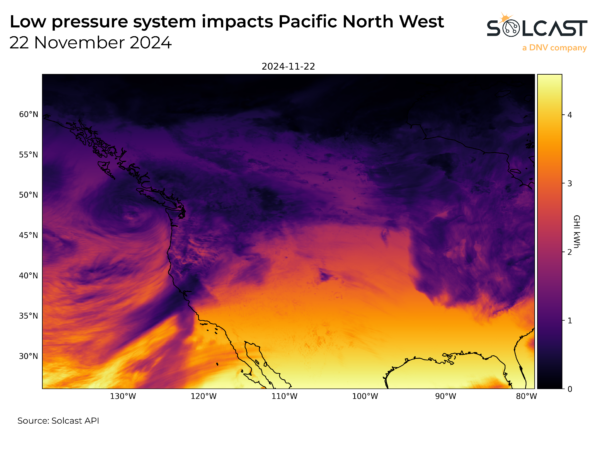
Solar irradiance dropped more than 10% below the long-term average across nearly all the US and Canada. This widespread reduction was driven by dynamic weather patterns. Northwesterly winds from a record-breaking deep low-pressure system swept clouds from the Pacific Ocean over the coastal regions and inland ranges. Meanwhile, tropical maritime air masses brought moist air to the deep South and Appalachia, which resulted in cloudier conditions.
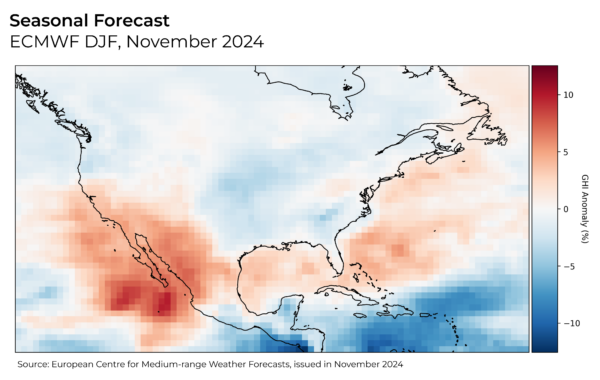
 These developments defied earlier seasonal forecasts, which had predicted above-average irradiance for the November-January period. More recent forecasts have become more pessimistic but still suggest improved conditions in the coming months.

Southern Texas, Florida, and the northeast megalopolis emerged as exceptions to the generally unfavorable conditions. In these regions, clearer skies contributed to better-than-average solar performance, a boon for solar asset managers in an otherwise challenging month. New York and New England ISOs each saw 10% more behind-the-meter solar generation than expected for a typical November.

In the latter part of the month, the Pacific Northwest and western Canada faced a series of storms that brought heavy rains, snow, and powerful winds, resulting in widespread power outages and poor solar conditions. Similarly, the central US endured greater-than-usual
precipitation, including thunderstorms and snowfall around Election Day, while the Thanksgiving period was marked by rain and snow in the Northeast due to a low-pressure system. This added to the complicated solar energy generation during the holiday period.
Solcast produces these figures by tracking clouds and aerosols at 1-2km resolution globally, using satellite data and proprietary AI/ML algorithms. This data is used to drive irradiance models, enabling Solcast to calculate irradiance at high resolution, with typical bias of less than 2%, and also cloud-tracking forecasts. This data is used by more than 300 companies managing over 150GW of solar assets globally.
The views and opinions expressed in this article are the author’s own, and do not necessarily reflect those held by pv magazine.
This content is protected by copyright and may not be reused. If you want to cooperate with us and would like to reuse some of our content, please contact: editors@pv-magazine.com.


By submitting this form you agree to pv magazine using your data for the purposes of publishing your comment.
Your personal data will only be disclosed or otherwise transmitted to third parties for the purposes of spam filtering or if this is necessary for technical maintenance of the website. Any other transfer to third parties will not take place unless this is justified on the basis of applicable data protection regulations or if pv magazine is legally obliged to do so.
You may revoke this consent at any time with effect for the future, in which case your personal data will be deleted immediately. Otherwise, your data will be deleted if pv magazine has processed your request or the purpose of data storage is fulfilled.
Further information on data privacy can be found in our Data Protection Policy.