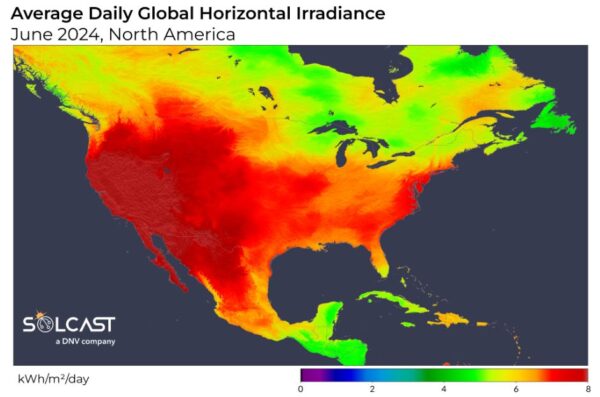
Summer weather and a heat dome have brought increased irradiance to both US coasts, with the strongest impact in the North East, while New Mexico and regions through the midwest experienced below-average irradiance due to increased cloud cover and atmospheric disturbances, according to analysis using the Solcast API.

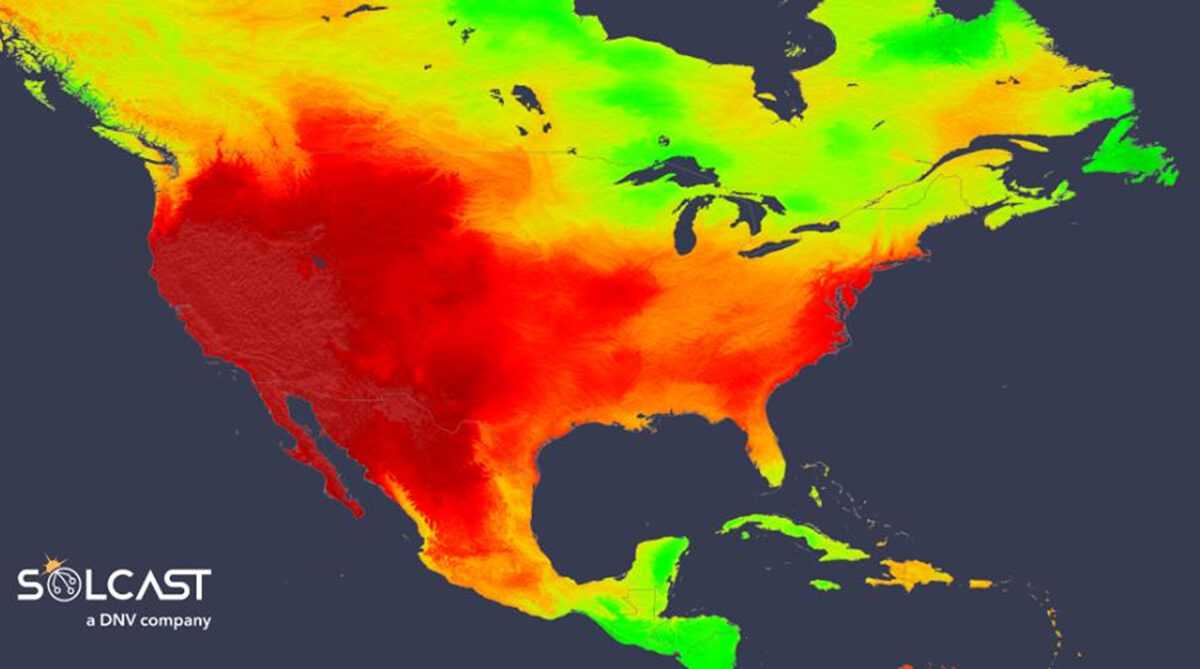
Much of the continental United States saw irradiance moderately above average, 5-10% above historical June averages, with the increase most notable along the East Coast. The “heat dome” that dominated much of June was accompanied by upper-atmosphere subsidence which suppressed cloud formation, allowing more sunlight to reach the ground. In contrast, the Gulf of Mexico experienced increased precipitation and cloudiness. However, prevailing winds kept most of these clouds offshore, except for the tip of Florida. The area around the Great Lakes saw up to 10% below average irradiance due to the additional heat enhancing evaporation and cloud formation.
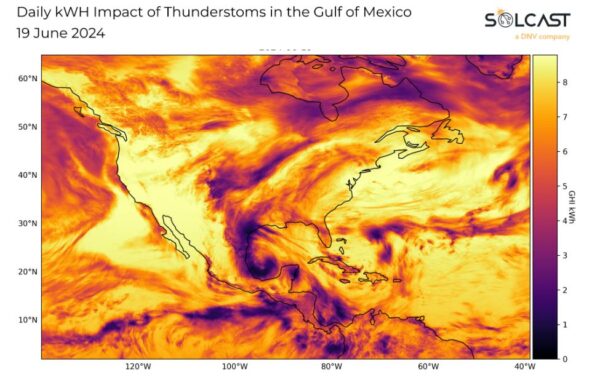
Despite the heatwave, New Mexico saw irradiance 5-10% below typical levels. This deviation was caused by a tropical disturbance in the Gulf of Mexico, which was observed on June 19. This disturbance brought moisture and atmospheric instability, triggering thunderstorms over New Mexico a few days later.

These thunderstorms caused flash floods and large hail in the region. While these events are not widespread enough to fully extinguish the wildfires across the state, it has impacted solar panel performance. Hail can damage and destroy solar panels, but many utility-scale solar farms in this latitude employ single-axis tracking systems that can stow panels in a vertical position to reduce damage risk. Smoke from wildfires also impacts irradiance by soiling panels and reducing light transmission through the atmosphere.

This year, the Summer Solstice happened on June 20. As the sun reaches its highest point in the sky in the Northern Hemisphere, irradiance also typically peaks around this time of year across North America. However, in Central America, this is somewhat offset by the
increased cloudiness of the tropical wet season.
Solcast produces these figures by tracking clouds and aerosols at 1-2km resolution globally, using satellite data and proprietary AI/ML algorithms. This data is used to drive irradiance models, enabling Solcast to calculate irradiance at high resolution, with typical bias of less than 2%, and also cloud-tracking forecasts. This data is used by more than 300 companies managing over 150GW of solar assets globally.
The views and opinions expressed in this article are the author’s own, and do not necessarily reflect those held by pv magazine.
This content is protected by copyright and may not be reused. If you want to cooperate with us and would like to reuse some of our content, please contact: editors@pv-magazine.com.


By submitting this form you agree to pv magazine using your data for the purposes of publishing your comment.
Your personal data will only be disclosed or otherwise transmitted to third parties for the purposes of spam filtering or if this is necessary for technical maintenance of the website. Any other transfer to third parties will not take place unless this is justified on the basis of applicable data protection regulations or if pv magazine is legally obliged to do so.
You may revoke this consent at any time with effect for the future, in which case your personal data will be deleted immediately. Otherwise, your data will be deleted if pv magazine has processed your request or the purpose of data storage is fulfilled.
Further information on data privacy can be found in our Data Protection Policy.