From pv magazine ESS News site
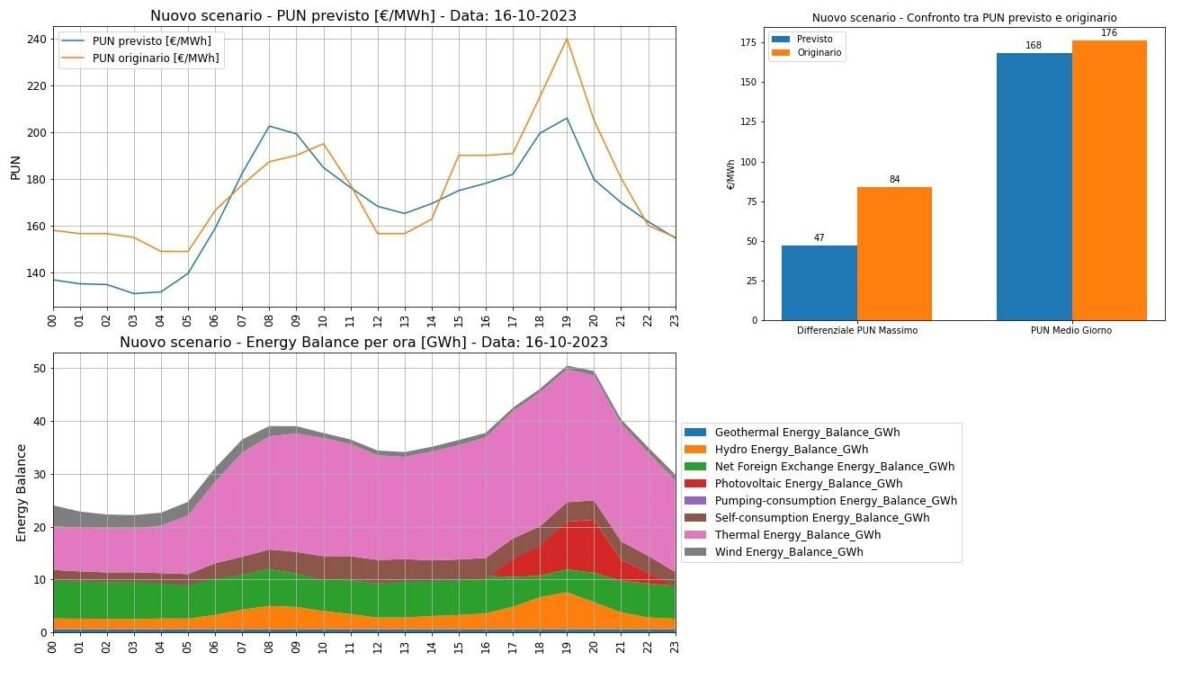
As an energy expert embedded in utility operations, Leo uses deep learning and machine learning codes for analysis and forecasting to analyze and simulate market scenarios and optimize portfolio management strategies. In his most recent analysis, Leo used deep learning techniques to simulate PUN trends concerning the installation of utility-scale batteries. The PUN (Italian acronym for Prezzo Unico Nazionale, “National Single Price”) – the wholesale reference price of electricity purchased on the Borsa Elettrica Italiana market (IPEX – Italian Power Exchange) – represents the national weighted average of the zonal sales prices of electricity for each hour and for each day.
Graphs of electricity demand in power grids, look a bit like a duck or a camel (called the camel-backed curve here), with high points in the morning and evening when people are relying on the grid, and a big dip in the middle of the day, which is also when many people use their own solar instead and need less from the grid.
According to Leo, BESSs decrease the maximum electricity price, increase the minimum price, and have a season-dependent effect on the average price: it would decrease on days with little sunshine, and increase slightly on high PV production.
BESS allow PV to avoid feeding into the grid during low PUN daytime hours and to put electricity into the grid during hours of darker, high PUN hours. This can pay back the higher costs for BESS and increase earnings, but it depends on the context, right? Can you explain?
Donato Leo: The shape of the PUN curve is closely related to the peculiarities of the generation fleet, which, in the case of PV, is not yet massively equipped with BESS and is therefore constrained to produce and feed in during sunshine hours. The progressive adoption of BESS (and the development of storage services provided by third parties) will lead PV operators to store energy during the current lower-remuneration sunshine hours and then feed it into the grid during the PUN peak hours, likely flattening its current camelback curve. If this is a plausible scenario, it is clear that, in such a context, greater gains will be enjoyed for a time by PV utility scale operators who first use BESS, because they will initially find the current PUN “camel back curve” unchanged (or nearly so), with its considerable daily spread between daytime PUNmax and PUNmin.
You have used deep learning techniques to create an algorithm to understand how the PUN curve – now precisely camel-back shaped – might change. Going into detail, it seems that the curve would lose the second evening hump, retaining only the first one during the hours when the energy input is absent. Or it would have both humps smoothed out anyway, right? What would that mean for battery remuneration?
DL: Let me preface this by saying that the algorithm whose results you have seen in my Linkedin posts is the result of initial convolutional neural network (CNN) training, based on historical hourly stock market and energy balance data from 2023, and this first part of 2024. Therefore, the relevant forecasts should be taken with due caution, also taking into account that, in the examples I posted, I assumed drastic massive shifts in PV production from daytime to evening hours: in between, however, there are the impacts of the unpredictable strategies of operators, in reaction to those adopted by first movers.
To continue reading, please visit our new ESS News site
This content is protected by copyright and may not be reused. If you want to cooperate with us and would like to reuse some of our content, please contact: editors@pv-magazine.com.


By submitting this form you agree to pv magazine using your data for the purposes of publishing your comment.
Your personal data will only be disclosed or otherwise transmitted to third parties for the purposes of spam filtering or if this is necessary for technical maintenance of the website. Any other transfer to third parties will not take place unless this is justified on the basis of applicable data protection regulations or if pv magazine is legally obliged to do so.
You may revoke this consent at any time with effect for the future, in which case your personal data will be deleted immediately. Otherwise, your data will be deleted if pv magazine has processed your request or the purpose of data storage is fulfilled.
Further information on data privacy can be found in our Data Protection Policy.