
With signs of a possible switch to La Niña conditions, solar asset and grid operators will be looking to understand the impact this change could have on US solar production. Based on currently available data, the Atlantic hurricane season is expected to intensify to look more like a La Niña year, leading to more frequent hurricanes. La Niña years typically result in below-average solar irradiance in the Gulf of Mexico, while increasing solar irradiance along the Atlantic Coast of the USA, according to analysis using the Solcast API.

In La Niña years, the Gulf of Mexico historically sees irradiance levels up to 10% below the long-term average due to increased storm activity. La Niña, characterized by cooler sea surface temperatures in the equatorial Pacific, impacts the Atlantic hurricane season on the
other side of the continental USA by shifting weather patterns. The cooler temperatures in the Pacific shift the jet stream further north, reducing vertical wind shear in the Atlantic. Normally, higher wind shear suppresses hurricane formation by disrupting their vertical
structure. However, with reduced wind shear, more hurricanes can form and develop more intensely. These conditions lead to more hurricanes, convection and cloudiness in the Gulf of Mexico, resulting in decreased solar irradiance. Whether or not we actually see a shift to La Niña in 2024, these patterns are already forming, indicating a likely reduction in summer irradiance for the Gulf Coast.
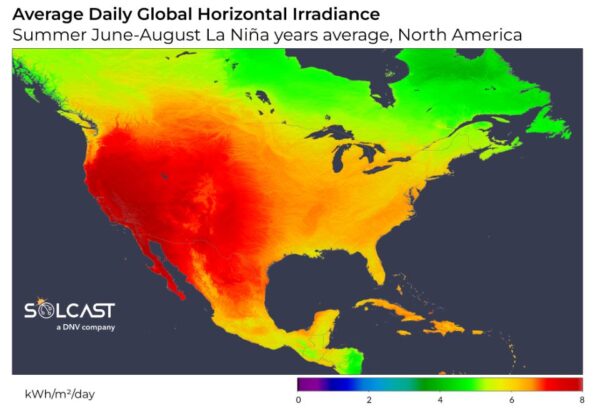
In contrast, the Atlantic coast of the USA has historically seen up to 5-10% above-average irradiance during summer months in previous La Niña events. Despite the higher number of hurricanes that can transition into mid-latitude cyclonic storms along the East Coast, the
periods between these storms experience relative stability. In between these large storms, the reduced cloud convection and rainfall lead to longer periods of clear skies. These calm periods outweigh the impacts of increased hurricane activity, leading to higher average overall solar irradiance along the East Coast for summers impacted by this weather pattern.
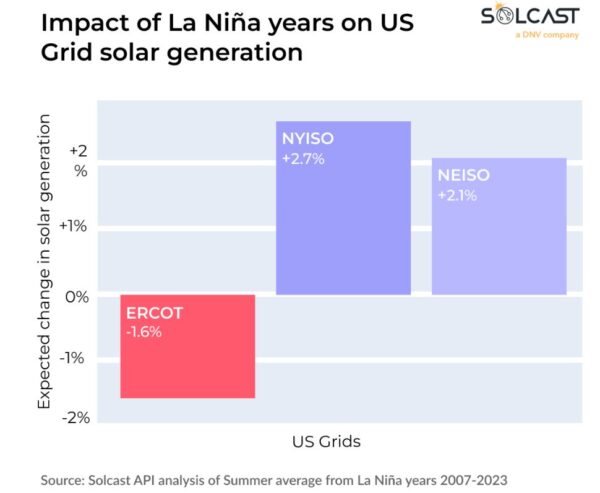
Using this climate analysis, it is possible to apply these possible weather patterns to the current distribution of solar generation across the US. Analysis using the Solcast API shows that a typical La Nina summer would mean 2.7% more rooftop solar generation for the New York ISO (NYISO), and 2.1% for New England ISO (NEISO). In contrast, the large number of utility scale assets in the Electric Reliability Council of Texas (ERCOT) sees lower production in a typical La Niña summer, down by -1.6%.+
Grid Aggregation models are built using available production information, and applying Solcast’s irradiance data to those models. Solcast produces these figures by tracking clouds and aerosols at 1-2km resolution globally, using satellite data and proprietary AI/ML algorithms. This data is used to drive irradiance models, enabling Solcast to calculate irradiance at high resolution, with typical bias of less than 2%, and also cloud-tracking forecasts. This data is used by more than 350 companies managing over 300 GW of solar assets globally.
The views and opinions expressed in this article are the author’s own, and do not necessarily reflect those held by pv magazine.
This content is protected by copyright and may not be reused. If you want to cooperate with us and would like to reuse some of our content, please contact: editors@pv-magazine.com.


By submitting this form you agree to pv magazine using your data for the purposes of publishing your comment.
Your personal data will only be disclosed or otherwise transmitted to third parties for the purposes of spam filtering or if this is necessary for technical maintenance of the website. Any other transfer to third parties will not take place unless this is justified on the basis of applicable data protection regulations or if pv magazine is legally obliged to do so.
You may revoke this consent at any time with effect for the future, in which case your personal data will be deleted immediately. Otherwise, your data will be deleted if pv magazine has processed your request or the purpose of data storage is fulfilled.
Further information on data privacy can be found in our Data Protection Policy.