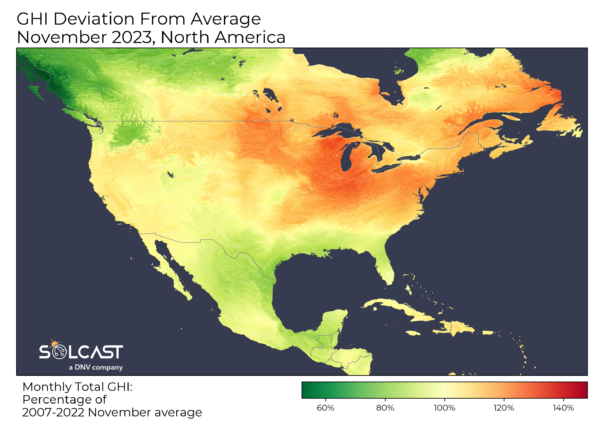
Data analyzed by Solcast, via the Solcast API, shows there was unusually high irradiance in large swathes of Northeast North America due to anomalous high pressure that kept Atlantic moisture offshore. In contrast, the Gulf Coast received notably lower irradiance resulting from atmospheric shifts and cloud formation produced by the same high-pressure system.

The North-East saw clear skies, reaching irradiance levels up to 30% above the long-term November average. This was an unusually strong and widespread anomaly stretching from Oklahoma US to Quebec Canada. The driving force behind this high irradiance is the anomalous high pressure across the continental US that kept Atlantic moisture and resulting clouds from impacting solar assets located in these regions.
The Gulf Coast experienced cloudier conditions from Florida to the east coast of Mexico, with irradiance around 20% below the long-term November average. The anomalous high pressure system that brought increased sunshine farther north, induced lower pressure in the Gulf of Mexico, leading to increased atmospheric instability and cloud formation, reducing solar potential.
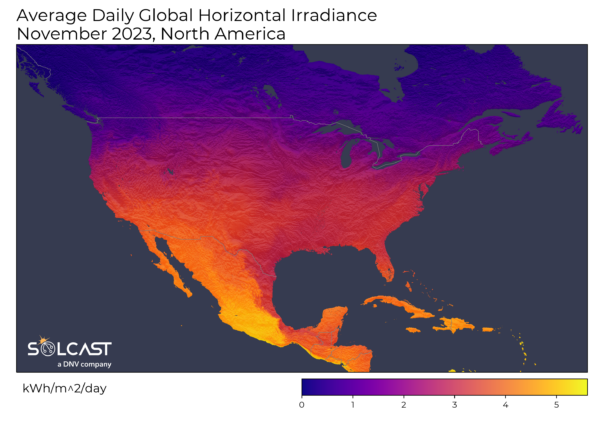
The Sierra Madre Occidental mountain range played a major role, shielding western Mexico from the Gulf’s moisture. The large disparity caused by the mountains can be seen in the average daily GHI data, with areas west of the mountains averaging 4-5 kWh/m2 across the month in clear contrast to the 3-4 kWh/m2 east of the mountains.

Despite the cloud-inducing impacts of the developing El Niño weather pattern along the US West Coast, a balance was achieved as the drying effects of the anomalous high pressure countered its effects. This pattern allowed solar asset operators on the US West Coast to still enjoy irradiance levels typical for November. However, further north along the west coast, the same high-pressure system diverted Pacific moisture away from the continental United States and towards British Columbia.
This redirection resulted in irradiance as much as 40% below the long-term average in British Columbia. Though significant in relative terms, this represented a small absolute reduction, considering the total solar potential in this region is only around 1 kWh/m2/day this time of year.
Solcast produces these figures by tracking clouds and aerosols at 1-2km resolution globally, using satellite data and proprietary AI/ML algorithms. This data is used to drive irradiance models, enabling Solcast to calculate irradiance at high resolution, with typical bias of less than 2%, and also cloud-tracking forecasts. This data is used by more than 300 companies managing over 150GW of solar assets globally.
The views and opinions expressed in this article are the author’s own, and do not necessarily reflect those held by pv magazine.
This content is protected by copyright and may not be reused. If you want to cooperate with us and would like to reuse some of our content, please contact: editors@pv-magazine.com.


1 comment
By submitting this form you agree to pv magazine using your data for the purposes of publishing your comment.
Your personal data will only be disclosed or otherwise transmitted to third parties for the purposes of spam filtering or if this is necessary for technical maintenance of the website. Any other transfer to third parties will not take place unless this is justified on the basis of applicable data protection regulations or if pv magazine is legally obliged to do so.
You may revoke this consent at any time with effect for the future, in which case your personal data will be deleted immediately. Otherwise, your data will be deleted if pv magazine has processed your request or the purpose of data storage is fulfilled.
Further information on data privacy can be found in our Data Protection Policy.