North Africa’s dry deserts and hot summers lead to excess solar potential that offers significant power opportunities for development with appropriate investment. However, despite the proximity to Europe across the Mediterranean, the climatology of Africa leads to very different seasonal generation patterns from what European solar producers experience. Data analysed by Solcast, via the Solcast API, shows this seasonal variance from summer to winter in 2023.
Egypt leads North African nations in solar capacity, with 2 GW installed, and 17 GW announced or in development. Following closely are Morocco with 700 MW installed, 12.5 GW prospective capacity and Algeria with 454 MW operational and 5 GW prospective.
The high solar generation potential in North Africa is already delivering power through two links from Morocco to Spain, and discussions are in progress for a link to South-West England. Understanding the seasonal patterns of generation in Africa is essential in consideration of power needs for local grids, as well as decisions to invest and build additional capacity for dispatch to Europe.
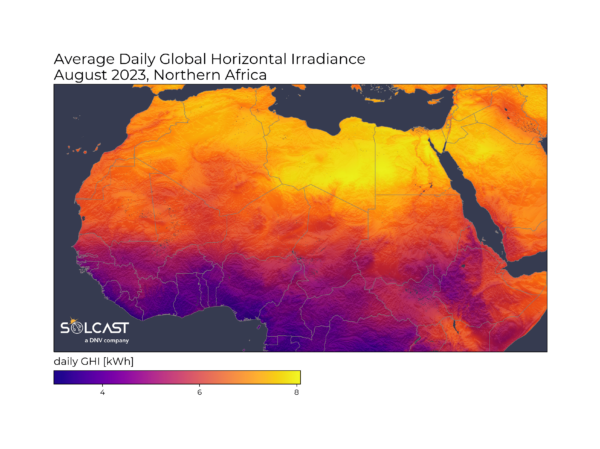
Unsurprisingly for a desert region, summers are hot in Northern Africa, mainly because the sub-tropical ridge of high pressure suppresses rain and clouds across the region. This leads to strong irradiance through most of the summer, with only rare summer storms impacting generation. This is seen in the above image from August 2023, where Northern Africa saw consistently high irradiance across the board.
Further south, summers see seasonal rains, bringing frequent large cloud events and significantly reducing typical irradiance. These large cloud covers are associated with the Intertropical Convergence Zone, and also see high rainfall at this time of year.
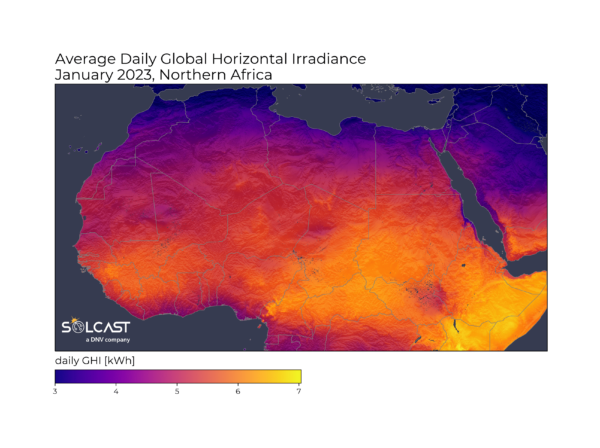
In contrast, winters see the solar potential reach further south, as shorter days in the north decrease irradiance and the intertropical convergence-related cloud moves south of the equator, leaving western Africa from Senegal to Nigeria with clearer days where they benefit from higher irradiance. This seasonal pattern can be seen in the below January 2023 average for the region.
Solcast produces these figures by tracking clouds and aerosols at 1-2km resolution globally, using satellite data and proprietary AI/ML algorithms. This data is used to drive irradiance models, enabling Solcast to calculate irradiance at high resolution, with typical bias of less than 2%, and also cloud-tracking forecasts. This data is used by more than 300 companies managing over 150GW of solar assets globally.
The views and opinions expressed in this article are the author’s own, and do not necessarily reflect those held by pv magazine.
This content is protected by copyright and may not be reused. If you want to cooperate with us and would like to reuse some of our content, please contact: editors@pv-magazine.com.


By submitting this form you agree to pv magazine using your data for the purposes of publishing your comment.
Your personal data will only be disclosed or otherwise transmitted to third parties for the purposes of spam filtering or if this is necessary for technical maintenance of the website. Any other transfer to third parties will not take place unless this is justified on the basis of applicable data protection regulations or if pv magazine is legally obliged to do so.
You may revoke this consent at any time with effect for the future, in which case your personal data will be deleted immediately. Otherwise, your data will be deleted if pv magazine has processed your request or the purpose of data storage is fulfilled.
Further information on data privacy can be found in our Data Protection Policy.