From pv magazine 09/2021
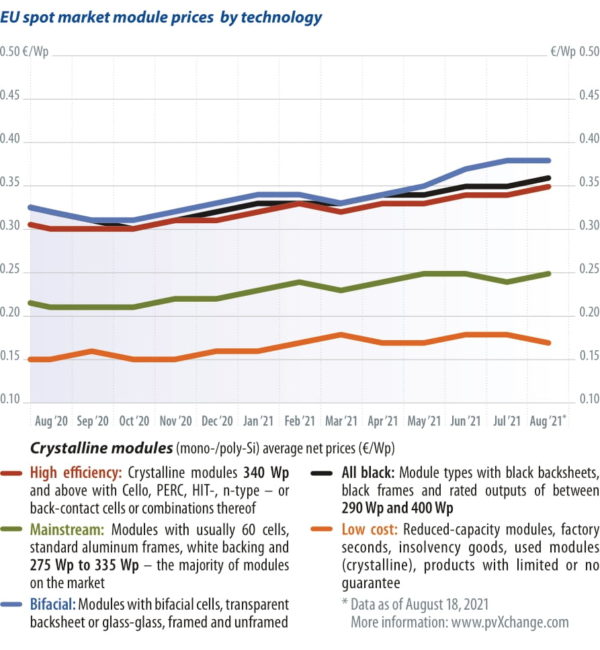
 There is no end in sight to the surge in prices for PV modules, leaving stakeholders to either postpone the construction of their PV projects indefinitely or – like the customers of the aforementioned vegetable hawker – secure the coveted commodity sooner rather than later and avoid having to dig even deeper into their pockets. Price differences for comparable module brands and technologies are actually a function of whether they still have to be shipped from Asia. But what has gone awry here, making longer-term supply contracts no longer sensible, and planning security a thing of the past?
It all started when the international movement of goods met the Covid-19 pandemic. First, individual plants came to a standstill, preventing urgently needed goods from entering circulation. Container ships could not be utilized to capacity, and deliveries were delayed. By the time production resumed, at least in China, the virus had already reached the shipment hubs. Freight forwarders, ports and customs authorities could only operate at a much-diminished capacity, if at all. Employees were absent due to illness, seamen and dockworkers often had to go into quarantine, and the movement of goods could not flow freely. There were times when important overseas ports had to be closed and cordoned off for days on end. Due to these uncertainties, existing capacities at the shipping companies were reduced so as not to leave shippers with unused capacities and spiraling costs.
Demand comeback
Once uncertainty about the course of the pandemic had somewhat subsided in early 2021, the chaos in the global flow of goods really kicked in. As a result of lockdowns and working from home, there was a growing need to make home improvements and pursue a more sustainable lifestyle. After a lull of several months, consumption suddenly went crazy, at least in industrialized countries, and the solar industry was no exception.
Many stakeholders in Germany report a lucrative first half of the year. But shipping companies and freight forwarders had scaled back their capacities and were not prepared for a rapid increase in the volume of goods. In addition, many service providers and government agencies were still not operating at normal capacity. Within a short period, demand for transport far outstripped supply. Cargo ships were backed up outside ports, and as a result, turnaround times in the international flow of goods also increased by 20% to 30% compared to pre-pandemic levels.
The bottom line is that too many goods are waiting on too few ships worldwide, and logistics chains are not functioning as they should. As a result, freight rates have exploded since last fall. Whereas a container of sea freight from China to Rotterdam cost roughly $1,500 to $2,000 before the pandemic, prices have now skyrocketed to $15,000 to $18,000. In terms of module capacity, the freight component has increased tenfold from the previous level of around €0.004-€0.006/W, up to €0.05-€0.06/W. Transport costs thus no longer account for just 2% of the total price, but up to 20%.
Chinese manufacturers were quick to realize that such expensive products no longer sell well in Europe. In some cases, delivery quantities are being dialed back, and in others deadlines are being delayed until an affordable carrier can be found. The latest trick, however, is the attempt to pass on the freight risk for future deliveries to the buyer. Goods are no longer offered with the standard CIF/FCA Rotterdam or DDP Incoterms, delivery-inclusive to the building site or warehouse, but instead EXW or FOB – that is, ex-works or to the containership. This means that price increases for transport are fully borne by the customer, making it difficult or impossible to calculate the purchase price reliably or set a binding delivery date.
The concern is that few end customers will accept this uncertainty. For this reason, I strongly advise against accepting such contractual terms, at least as long as the freight traffic situation is so unpredictable. High transport costs permeate the entire value chain. Steadily rising prices for raw materials and semifinished goods are eroding the margins of manufacturers and retailers. When these costs are passed on to consumers, they fuel inflation. This is a vicious cycle that we can probably only break by increasing local value creation and reducing international freight traffic.
About the author
Martin Schachinger has been active in renewable energy for more than 20 years. In 2004, he founded the online trading platform pvXchange.com, where wholesalers, installers, and service companies can purchase standard components, solar modules, and inverters that are no longer manufactured, but are still urgently needed to repair defective PV systems.
This content is protected by copyright and may not be reused. If you want to cooperate with us and would like to reuse some of our content, please contact: editors@pv-magazine.com.


1 comment
By submitting this form you agree to pv magazine using your data for the purposes of publishing your comment.
Your personal data will only be disclosed or otherwise transmitted to third parties for the purposes of spam filtering or if this is necessary for technical maintenance of the website. Any other transfer to third parties will not take place unless this is justified on the basis of applicable data protection regulations or if pv magazine is legally obliged to do so.
You may revoke this consent at any time with effect for the future, in which case your personal data will be deleted immediately. Otherwise, your data will be deleted if pv magazine has processed your request or the purpose of data storage is fulfilled.
Further information on data privacy can be found in our Data Protection Policy.