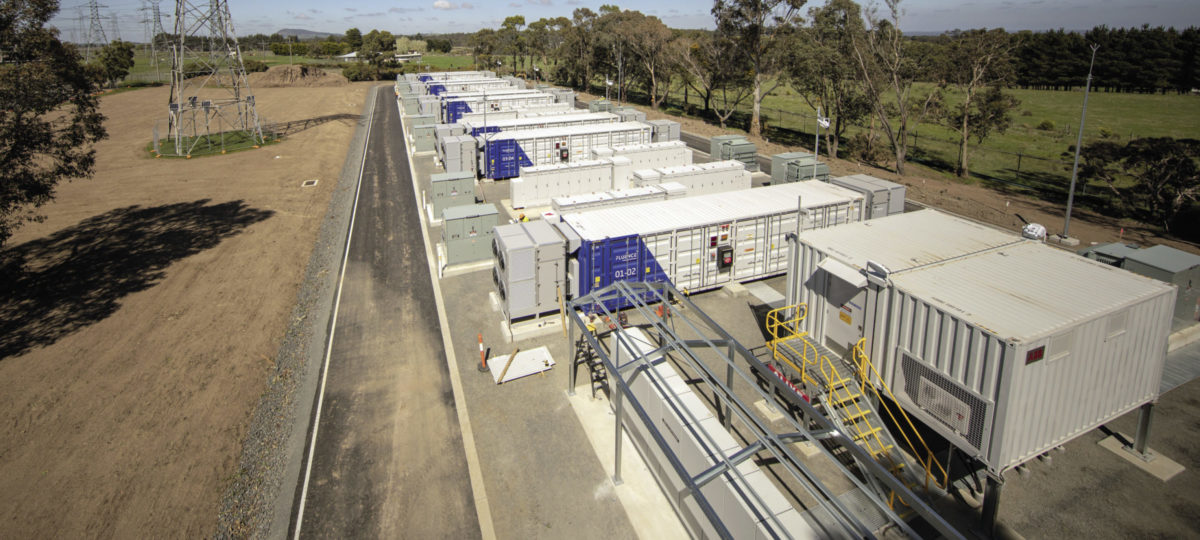
From pv magazine USA
According to the latest edition of Wood Mackenzie’s U.S. energy storage monitor, the country deployed 476 MW of energy storage in the third quarter, or 240% more than was installed in the second quarter, which just so happened to be the previous quarterly record for installed capacity. That 476 MW mark represents more than 500% year-over-year growth from the third quarter of 2019.
The jump in capacity forced WoodMac to edit the y-axis on its deployment graph, producing a pretty funny result:

As the graph shows, this exponential capacity increase was driven predominantly by the front-of-the-meter (FTM) market, with that segment alone representing more capacity than the total installations across all segments in any other quarter from the past seven years.
Beyond megawatts
Pure megawatts installed, however, are not the main focus of deployed storage, with the other half of the story being told by MWh deployment. What’s interesting here is that, while the 764 MWh deployed in the third quarter is a record in its own right – more than doubling the previous record of 378 MWh in the fourth quarter of 2018 – that figure is less than double that of the 476 MW installed. Yet most batteries are developed for four-hour charge or discharge.
The answer to this oddity comes from California, where numerous installations were built for only one hour of capacity, though many were also planned or built with the capability to move to four hours in duration in the future. This phenomenon includes LS Power’s Gateway Energy Storage project, which is the largest grid battery in the world, clocking in at 230 MW and 230 MWh, with plans to expand to 250 MW/250 MWh.
Just as it was with megawatts deployed, FTM installations drove this record quarter, with additions growing 475% compared to the second quarter and beating the previous FTM record, set in the first quarter of 2017, by nearly 200%. Outside of the FTM explosion, the residential storage market saw more modest quarter-over-quarter gains of 7% across both megawatts and megawatt-hours deployed, but these gains were still record-setting deployments in their own right.
As has been true with solar, the non-residential storage market has been the hardest hit by the Covid-19 pandemic, shrinking by 3% in megawatt terms and 10% in megawatt-hour terms from the second quarter of 2020.
Future markets
Potentially the most impressive aspect of the third quarter’s record deployment figures is that California’s FTM market alone deployed more solar than the entire United States has done ins any other quarter in history. In terms of deployment by state, California’s FTM market led the way with 510 MWh, followed by New Jersey at 40 MWh and Arkansas at 10.5 MWh. On the residential side, California led the way again with 39 MWh, followed by Massachusetts at 17 MWh and Hawaii at 11 MWh. For the non-residential segment, surprise, surprise, California topped the rankings at 69 MWh, followed by Hawaii at 20 MWh and Arizona at 3.4 MWh.
According to WoodMac, 2020 is just the start of a tidal wave of storage set to come in the near future. By 2025, the market is set to grow to nearly 7.5 GW in 2025, representing sixfold growth over the projected 1.2 GW set to be installed by the end of this year. Alongside this capacity growth, the market is also expected to be a $7.3 billion annual market in 2025, after crossing the $1 billion mark in 2020. It currently sits at $1.4 billion.
This content is protected by copyright and may not be reused. If you want to cooperate with us and would like to reuse some of our content, please contact: editors@pv-magazine.com.


World energy has been increasing times 10 every century, and CO2 emissions with it. i.e. 2.25%/a. 2100 world primary energy has followed:
Ejt/a = 8.5 EJt/a + 4.5 EJt/a * Exp(0.0225 * (a – 1800))
giving 3852 EJt/a.
CO2 has been following:
280 ppm + Exp(0.0225 * (a – 1800))
since 1800.
Assuming “energy conservation” (nevermined energy is always conserved, cuts the 3852 EJt/a in half, that still leaves 2000 Ejt/a. Assuming 1 je = 3 Jt, this is equivalent to 21 TW continuous generation. Assumig 4/5 avaibility, requirement is ~25 TW busbar continuous capability.
Wind and solar energy, using Chinese and Cuban data, have 1/5 utilization. 25 TW capability at 1/5 utilization requires 125 TW nameplate wind and solar collection. 5 times consumption, meaning 4/5 of the power has to go to storage. Effectively all of it. Transmission, conversion, storage, recovery, reconversion and transmission again will use half the power. Result: to have wind and solar world 2100 requires 250 TW nameplate wind and solar collection.
Storage requirement is 3 days and 12 hours, meaning that each watt busbar requires
3 d * 12 h * 250 TW = 9000 tarawatt-hours storage. = 1 terawatt-year
At minimum 0.05 USD/watt-hour using NH3-H20 distillation/absorption storage, 1 TW-a storage costs ~440 Trillion USD
Battery storage will be at least twice this and, unlike NH3-H2O, wear out every 10 years.
250 TW nameplate wind and solar plus powerlines will cost at least 1000 Trillion USD. If the 0.0225 %/a holds, all numbers double. Bill me.
KW is a unit of power, the rate of energy moving. KWH is a unit of energy. When the author uses terms like ‘the country deployed 476 MW of energy storage’ it gets confusing because the units imply it is the rate at which energy can get into or out of the storage bank (power), but the verbiage implies it is the storage capacity (energy).