Bifacial modules have been around since the 1960’s, yet it has been the development of PERC (passivated emitter rear cell) technology that has significantly increased their efficiencies and created the potential for them to be a disruptive player in the solar PV market.
That said, there are many variables which must be addressed before bifacial modules can claim a significant market share. Cost is one of the biggest factors a big factor – particularly in the case of monofacial modules.

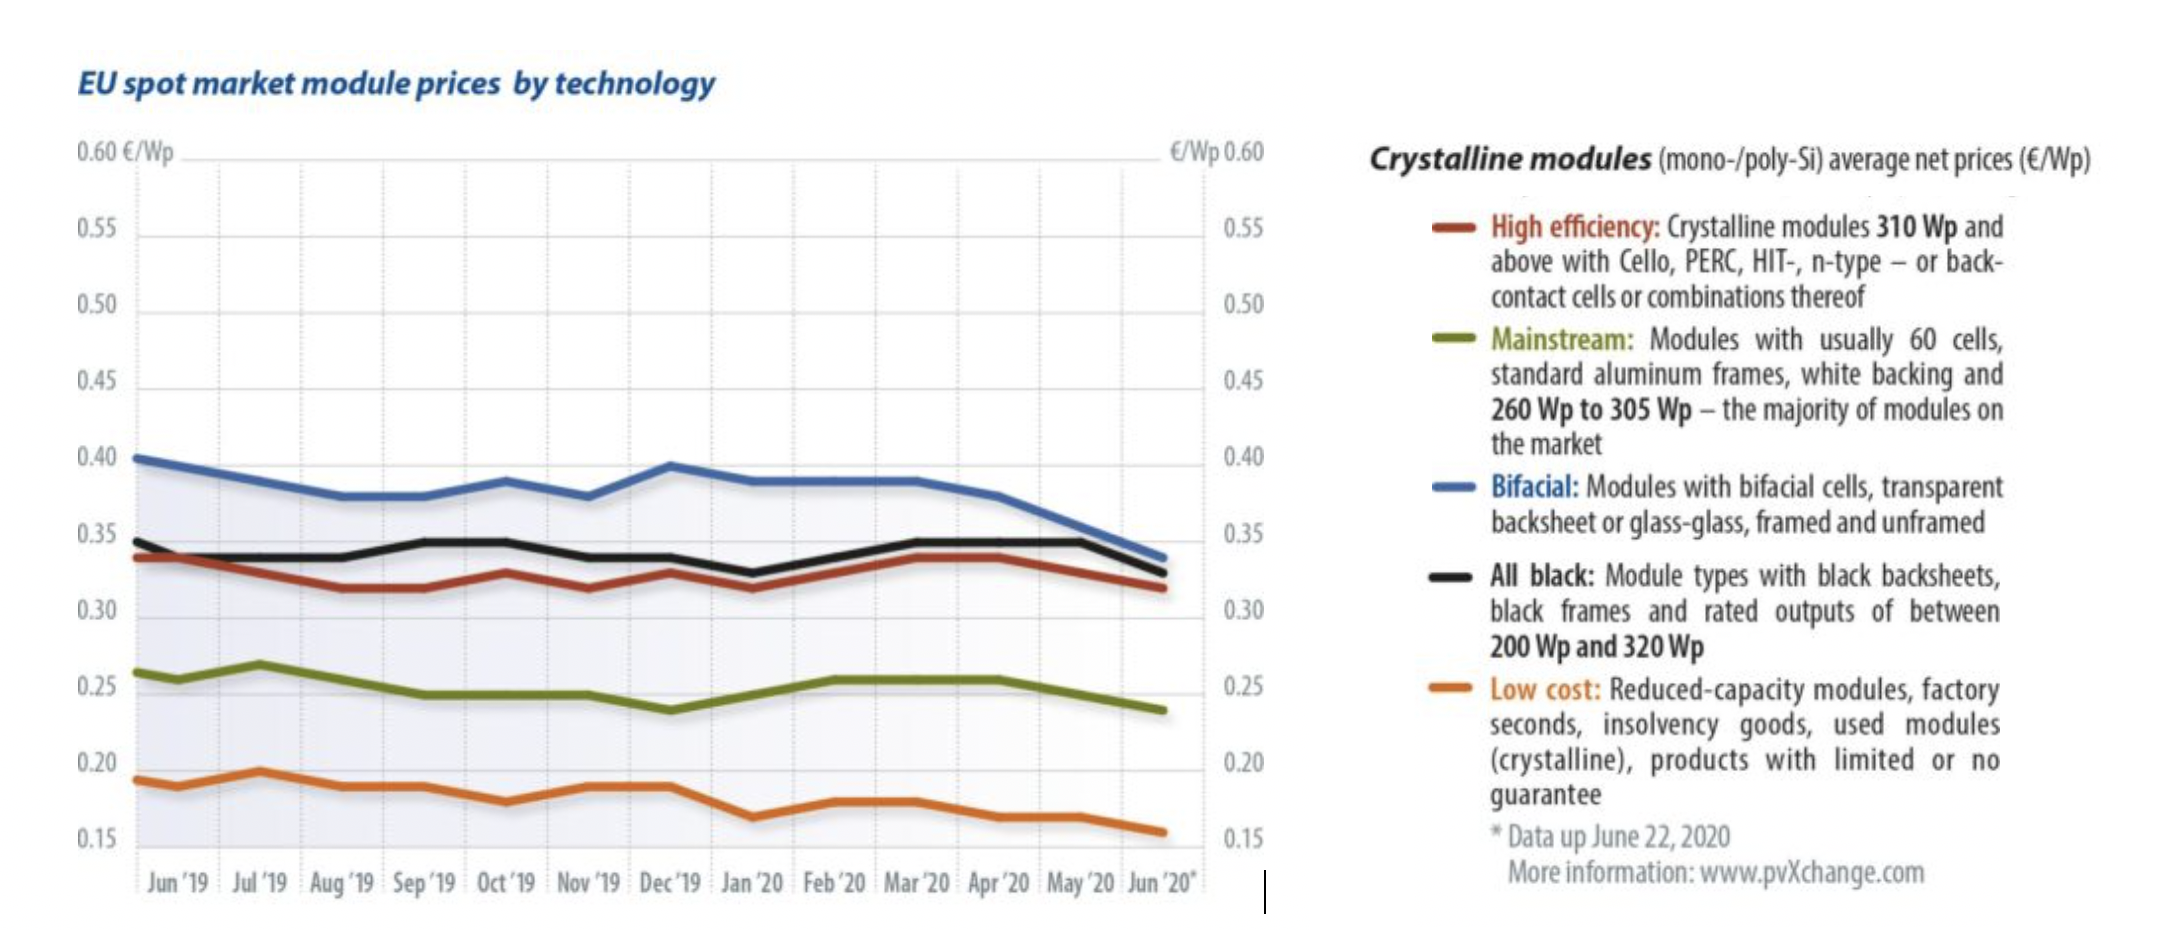
Like for standard solar modules, the cost of bifacial modules has fallen precipitously over the last two decades. Notably, as costs have decreased, so too has the cost gap between mono- and bifacial modules.

The graph above shows one of the main reasons why bifacial module market share is predicted to continue to increase. As the cost gap becomes smaller, and bifacial production increases (meaning more available data and improved design), the extra production costs resulting from producing the rear side of bifacial modules can compensate for additional costs.
But is increased production enough to cover the additional costs? The answer is: it's complicated. While the increased cost of equipment and installation costs of bifacial PV plants are not excessive, there are other factors preventing widespread adoption.
For instance, there are many design elements unique to bifacial systems that contribute to higher overall installation costs; in particular, the rear side of the modules. The DC design, site location, and installation can be more challenging for a bifacial plant versus one with monofacial modules, and this can create problems for investors. It is also quite difficult to accurately predict the increased output for a system design, due to the many variables that affect rear side production.
Accurate measurements
There is no doubt bifacial modules will increase power production. The question is how to accurately measure the cost of the bifacial plant, and how to accurately predict the power production with all of the variables accounted for.
Results and studies have shown that bifacial modules can produce additional power between 10-20% over monofacial panels. If conditions are optimized and single axis trackers adopted, the additional power can be as high as 30-40%.
It is important to bear in mind that we are looking for the optimum LCOE (levelized cost of electricity), not the maximum power possible. There are several ways to increase power production, but many of these options are not cost effective and, therefore, not practical in the market. For example, dual axis tracking can increase power production, but it is still too costly to be recommended. So a major obstacle for bifacial modules in the market is the difficulty in creating accurate simulations and thereby satisfying financial queries regarding the additional costs.
Improved testing and improved modeling have been underway for years, and improvements in available data regarding irradiance, and geospatial data have contributed greatly to improvements in these simulations. There have also been many bifacial test sites built, bifacial studies undertaken, and bifacial installations completed providing real data. In fact, despite all the obstacles and uncertainties, bifacial installations have grown rapidly in the last half decade, from only 97MW of installed global capacity in 2016, to almost 6 GW in 2019.
The largest bifacial plant to date – 224 MW – was completed in late 2019. That growth is predicted to continue. According to Wood Mackenzie Consultancy, bifacial modules will account for 17% of the global market for solar panels in 2024.
With all of the data from tests and completed installations, we do have a model of how to make bifacial panels work for a lower LCOE.
Some of the best practice recommendations to optimize your bifacial installation and achieve increased ROI and lower LCOE are as follows:
- Site selection: The cost of land affects how bifacial can be optimized. For places where land is scarce and expensive, panels should be laid flat on the ground to ensure maximum energy collection over a given land area. However, where land is cheap, bifacial modules can have optimal spacing and therefore higher yields. Also, bifacial yields are greater where the diffuse light energy is greater, which means at higher latitudes the bifacial yield will be greater than at lower latitudes.
- High albedo: The environment selected should have a high albedo. Desert sand is a good option. The best option is white concrete or highly reflective roof foil. Snow and ice also has very high albedo.
- Panel height: This will vary from site to site, but 1 meter has provided good benefit to cost ratios. Increasing panel height requires other variables to be measured as well, such as wind speed and lift from the tilt and therefore requires stronger ground mounts.
- Tilt: This will vary from site to site, but generally 2~15 degrees more than the monofacial tilt has been shown to be effective.
- Row distance: Again, this will vary from site to site, but 6 to 8 meters row distance has been shown to produce good results. Of course, the cost of land or the available space must be considered, and if the cost of land is too great, then a greater row distance will increase your LCOE. Ideally, somewhere that land is very cheap can be used to increase row distance cost effectively.
- Greater MPPT density: Using string inverters with more MPPTs (maximum power point tracking) is an effective way to reduce string mismatch and ensure efficient performance. The more MPPTs per watt the better.
- Single axis tracker: Researchers from the Solar Energy Research Institute of Singapore have concluded that bifacial installations with single axis tracking can increase energy yield by 35% and reach the lowest LCOE for most of the land area on the planet. Although dual-axis trackers achieve the highest energy generation, their costs are still too high and are therefore not as cost effective. The researchers wrote: “In general, with the same mounting structure, bifacial configuration outperforms monofacial configuration. Tracker configurations outperform fixed-tilt configurations significantly, with dual-axis tracker installations having marginally higher yield than one axis.”
Cost analyses have shown that the cost of equipment and installation of a bifacial PV plant will be around 5% higher than a comparable monofacial plant. Furthermore, the data shows that the cost of adding a single axis tracking system for optimal yields adds another 10% to the equipment and installation costs over an equivalent installation with no tracking.
Therefore, a bifacial, single axis tracking (1T) pv plant can cost approximately 15% more than a comparable monofacial non tracking PV plant.
The yields from a bifacial 1T plant can be well above 20%, up to 35 to 39% in some cases if conditions can be optimized.
After working with many calculations and reviewing many production models and spreadsheets, here is a table of reference values and examples to help understand some of the variables:
| Bifacial PV plant examples | ||
| No tracker, near equator, moderate albedo | Single axis tracker, high albedo, high latitude | |
| Albedo | 25% grass | 40-60% (achieved with desert sand white paint, or reflective roof ) |
| Rear side mismatch loss factor | 3% (achieved with high MPPT density | 3% (achieved with high MPPT density |
| Panel height | 1m | 1m |
| Single axis tracker | No | Yes |
| Row distance | 6m | 6m |
| Cost of land | Low | Low |
| Solar diffusion factor | Low (closer to equator) | High (achieved at higher latitudes) |
| Bifacial gain | 12-15% | 30-35% |
| Additional cost | 5-7% | 15-17% |
This sounds like a simple calculation, but we have one more obstacle to discuss, and that is the view from the finance side of the equation.
Due to the uncertainty in modeling the costs and production of bifacial PV plants, and the relatively small sample size of reliable performance data, investors are often unwilling to finance the full amount of predicted rear side production. Therefore, investors might only value a portion of the modeled bifacial gain.
For example, if a project had projected a gain of 10% over an equivalent monofacial project, a lender could be expected to provide 10% more debt financing than for the monofacial project. However, that lender may not value the full projected bifacial gain, due to the uncertainties we have discussed. They may only value the projected bifacial gains at 50%, meaning they would only offer 5% more debt financing over the monofacial project.
And because debt financing is generally the cheapest form of financing, the uncertainties in the modeling and simulation stage end up adding financing costs to the project, thereby increasing the LCOE.
Conclusion
In summary, the industry is currently still struggling to manage the variables of predicting the output of bifacial modules, and also to manage the costs of optimizing the power produced by bifacial modules. These obstacles are being slowly overcome, however, with each advance in data and technology.
About the author

Nick Lusson has 10 years’ experience in the solar industry in East Africa based in Nairobi. He is an author, motivational speaker and business consultant, currently serving as Business Development Executive for Jubaili Bros Solar.
The views and opinions expressed in this article are the author’s own, and do not necessarily reflect those held by pv magazine.
This content is protected by copyright and may not be reused. If you want to cooperate with us and would like to reuse some of our content, please contact: editors@pv-magazine.com.


This is a very realistic summary of the Bifacial technology in view of many recent developments. I can see a resemblance with the future of electric vehicles – in 3 years time, bifacial will become the standard because the main driver today is low LCOE. It is worth to mention that the bifacial gains mentioned are for PERC while using p-PERT technology allows bifaciality to reach new highs of >90% (proven), substantially higher than bifacial PERC (65-70%). Also, PERT technology provides an intrinsic close to zero Le TID, supporting even further the LCOE cost reduction. PERT technology allows to achieve all the benefits of the more expensive N-Type cells but using P-type Silicon. We are living amazing times in which solar energy won already the war of the energy future and it looks like Bifacial solar cells won already the war of the solar energy future with proven total efficiencies of 30% (no tracker) to 45% (with tracker), and all this at the same cost of PERC monofacial. Time to scale up!
Yes you are right! Great comment!
In our system, emphasizing profits can lead us to reject needed solutions to the climate crisis–a mistake. Bifacial tracking may indeed be worth developing, at least on a certain percentage of panels in each area, if it increases capacity factor significantly and increases power at the right times–for example at the edges of the daily duck curve and annual times of low production.
Yes, you are right it does add production at the edges of the curve. And overall there is a lower LCOE as well.
What if a reflecting object like Galvanized sheet come between Module and ground? Is the performance will decrease or increase or will remain same?
Hi,
yes there is an image in the article that shows the different albedo of different materials. The highest albedo on the image is reflective foil, and if you use highly reflective materials that have a high albedo the performance is increased.
Hi , can you explain the difference between ” monofacial HP” and “monofacial” in the graph?
Hi Lucile,
the HP refers to high power modules which are a bit more expensive than standard modules. Currently this is around 500W+ panels, they are a bit more expensive per watt than say 330W panels..