The global deployment of utility scale solar power has accelerated dramatically over the last decade. So, it is no surprise that every few weeks you see a headline like ‘The largest new solar power plant in the world'. But are solar projects really getting bigger and bigger? The truthful answer is ‘yes and no'. This is not very helpful – so let me explain.
Individual solar power plants
In the early days, solar project developers looked for suitable sites with a nearby connection to the electricity grid. They would arrange finance – often using feed-in-tariffs, loan guarantees or other incentives – and build the plant. The size of project was sometimes dictated by the incentive scheme. If that did not impose limits, developers aimed for economies of scale by maximising plant size, and then land area or grid connection capacity became the limiting factor.

Image: Wiki-Solar
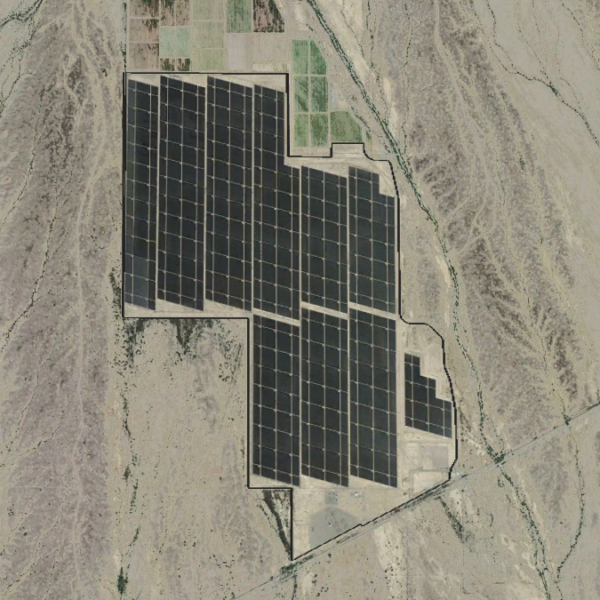
In 2008, the largest PV project at about 50 MWAC was near Olmedilla de Alarcón in Spain. By 2012 the record had risen to over 250 MWAC – the Agua Caliente solar farm in Arizona, later expanded to some 350 MWAC.
The largest concentrated solar power (CSP) projects topped 200 MW in 2013, with the Solaben project in Spain and Solana in the USA.
Meanwhile even larger solar plants – in the range 500 MW to 1000 MW (0.5 to 1 gigawatts) – were being planned.
Plants co-located in solar parks
By this time, a small number of national and state-level energy agencies had realised that solar power could be produced more economically if multiple projects were co-located in an area, where they could share grid connection and other site related costs.
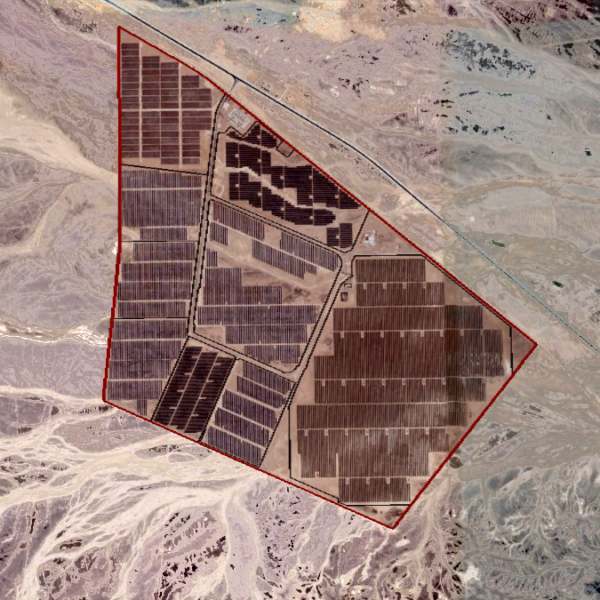
Probably the most notable early example is the Charanka Solar Park in the Patan district. When this was first opened in 2012 by Gujarat’s then chief minister, Narendra Modi, it had a combined capacity of 224 MW from 19 individual solar power plants, of which the largest were 25 MW each. It has since been expanded to over 600 MW of overall capacity. Agencies of the state of Gujarat arranged the grid connection and leased land to the project developers.

Image: Wiki-Solar
A similar approach was adopted in China most notably in Qinghai, Gansu, Ningxia and Xinjiang provinces. This approach lends itself particularly to centralised economies where state agencies can arrange grid connections, land allocation and other shared services. This model is also now being adopted in several countries in the Middle East and North Africa.
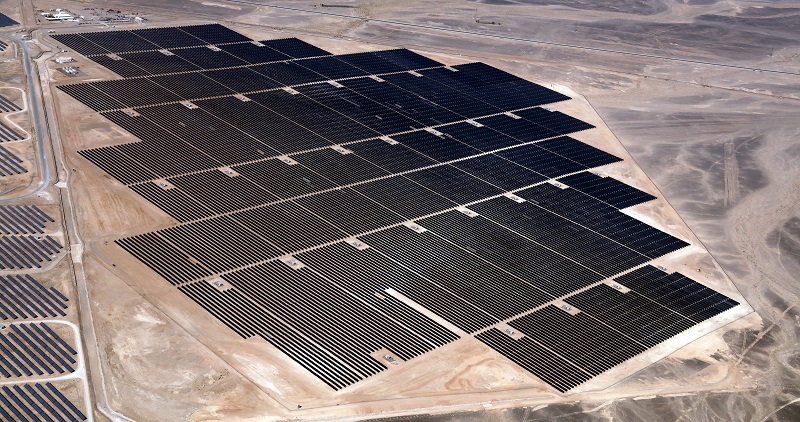
Many of these solar parks have been progressively expanded over the years, with several now achieving combined capacities running into the multi-gigawatt range.

Image: Wiki-Solar
Clusters of solar projects
The co-located solar park model has not been widely adopted in Europe and America where energy markets are more deregulated. However, less formal co-location of multiple projects can sometimes be found in areas where suitable land and grid connection capacity is plentiful and solar radiation is good.
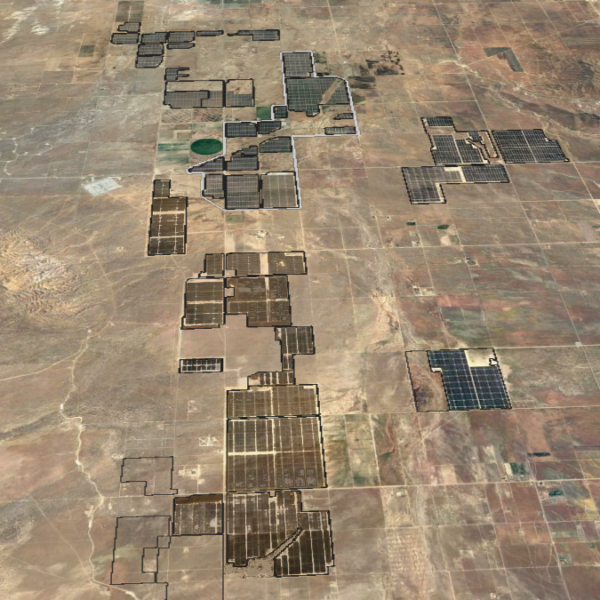
The Antelope Valley in Los Angeles county, for example, hosts dozens of solar power plants with a combined capacity of several gigawatts.
The largest power stations of each type
Press reports of the largest solar power station may refer any of these arrangements and may therefore ‘compare apples with pears’. Subsequent blogs in this short series will identify the world's largest solar power stations but will distinguish between individual plants and groups of multiple co-located projects.
For consistency, I use the terminology solar plant for an individual project that has been developed by a single developer or consortium, even if it is spread over several geographical plots or built in various phases. These single plants are often colloquially known as solar farms or ranches. Where multiple plants are co-located in a discreet area under the coordination of an identified agency, this will be called a solar park. Where multiple solar farms are co-located in an area without formal coordination, I call this a cluster. Readers should note that this terminology is not universally adopted, and that many developers and owners may choose to call individual plants a ‘solar park'.
Image Credits
The satellite views are from Google Earth, using imagery from Airbus, CNES, Copernicus, Digital Globe and Landsat. In these shots, individual plants are outlined in light or dark grey, while solar parks are outlined in red. Colour coding on Wiki-Solar’s maps is different.
Also for consistency, all capacities are quoted in MWAC to allow direct comparison between PV and CSP plants (and other forms of generation). Readers will be aware that the DC peak capacity of PV plants is typically 20% higher than the rated AC capacity, quoted here.
The next blog in a couple of weeks’ time will identify the largest solar parks in the world, to be followed subsequently by individual solar plants and then clusters.
About the author
Philip Wolfe has been active in the renewables arena since the 1970s and is the founder of Wiki-Solar. His book on utility-scale solar was published in 2012 and one on the early years of the terrestrial PV sector was published last year.
The views and opinions expressed in this article are the author’s own, and do not necessarily reflect those held by pv magazine.
This content is protected by copyright and may not be reused. If you want to cooperate with us and would like to reuse some of our content, please contact: editors@pv-magazine.com.


What does this really mean?
“Readers will be aware that the DC peak capacity of PV plants is typically 20% higher than the rated AC capacity, quoted here.”
PV modules are tested for power capacity at specific sun and temperature conditions, but there is nothing that intrinsically prevents them from producing more power than their “rating” indicates. (A common practice for safety margins is to design for 25% extra.) DC to AC inverters that couple arrays of modules to the utility power grid have internal “smart” safety limits that cause them to “limit” the amount of AC power that they convert. These two “ratings” are mostly independent of each other but the blog is warning that either number might be quoted and the DC value is often 20% larger than the AC value.