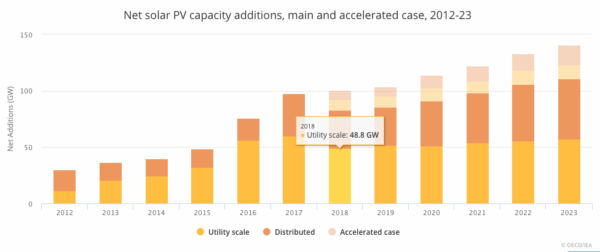
On Monday, the International Energy Agency released its latest forecast of global renewable energy markets, including numbers for solar PV deployment over the next five years. In the base case of Renewables 2018, the agency expects global solar PV deployment to fall 15% this year to 83 GW, but for installations to rise slowly thereafter to reach 111 GW in 2023.
IEA blames the short-term fall on Chinese policy changes. “The size of the global PV market over the forecast period is highly dependent on policies and market developments in China where the government decided to phase out feed-in tariffs (FITs) and introduced deployment quotas,” states IEA. “As a result, China’s solar PV deployment is expected to slow down, compared with 2017 growth levels. In the short term, global demand will decrease under the main case.”

The model also offers an “accelerated forecast” under which 101 GW of solar will be deployed this year, and for this to rise to 142 GW in 2023.
In terms of 2018 installations and the change from 2017 to 2018, IEA is notably more pessimistic than major market analysts. In forecasts released after China’s “5-31” policy change, IHS Markit estimated that the global solar market will still grow this year to reach 103 GW-DC, with Solar Power Europe forecasting 102 GW. IHS further expects 143 GW of solar installations globally in 2022 – faster growth than IEA even it its accelerated forecast.*
Both IEA and these other organizations agree that the reduction in Chinese support has led to lower module prices, which will spur demand globally. However, all major market analysts see this happening this year, and IEA is the lone holdout in stating that “demand recovery is expected after 2020”.
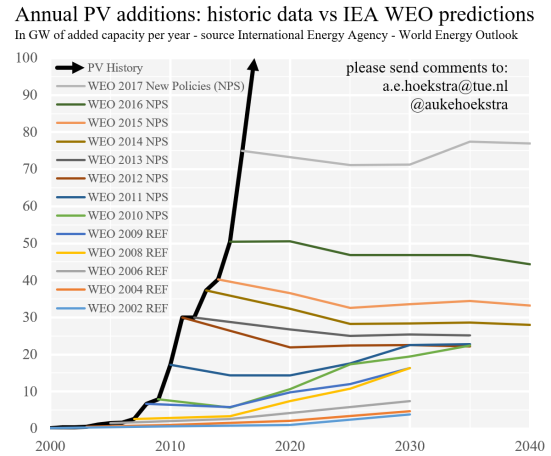
Unfortunately, such pessimistic forecasts are in line with a bad track record that the agency has of assuming relatively flat growth in solar deployment, versus the actual circumstances of exponential growth.
 A year ago, TU Eindhoven Researcher Auke Hoekstra published a graph which demonstrates the divergence between solar market forecasts of IEA in its World Energy Outlook and the actual track record of solar markets.
Even given its assumptions, IEA still expects 575 GW of solar to be deployed from 2018 through 2023, and for this to dominated renewable energy deployment. The agency also expects relative growth in distributed generation versus large-scale solar.
Update: This article was updated at 12:30 PM EST on October 9 to include the latest forecast by IHS Markit, which has reduced its 2018 estimate from 105 GW to 103 GW.
This content is protected by copyright and may not be reused. If you want to cooperate with us and would like to reuse some of our content, please contact: editors@pv-magazine.com.


Even the IEA has fallen for the canard that China’s new solar policy “introduced deployment quotas”. The May announcement – which you can readily google and run through its translator – is perfectly clear that the cap is on *distributed* solar (defined as <5MW) enjoying a FIT. It states explicitly that there is no cap on utility solar. The policy change is disruptive in the bad old sense, as it abruptly shifts decision-making to the provinces while at the same time replacing FITs with auctions, but this effect should be temporary.
IEA solar forecasts are, as you imply, junk anyway.
IEA willfully lowballs solar PV projections. They are a joke but it is not a surprise given who is funding them. Anyone who is knowledgeable about renewable energy cost paths does not even bother to read their reports.
That graph is just hilarious. Please send it to the press under the subject of “accuracy” or “crystal ball gazing”, they deserve some level of mockery.
Geothermal and solar pv are the future energy sources, as both these renewables draw energy from the natural heat sources i.e. the Earth and the Sun. While geothermal energy directly utilizes Earth’s heat for power generation and for direct applications, like space cooling, dehydration, solar energy captures Sun’s energy and converts the energy to electricity through solar photovoltaic cells. Quartz required to manufacture solar cells that can generate 1 MWe is about 10 tons. Manufacturing of PV cells involves two important stages, the MGS and the EGS. During the first stage an amount of 1756 x 106 kg of CO2 is released. Similar amount of CO2 is released during the conversion of EGS to ingot stage. The total amount of CO2 emissions during the lifecycle of solar pv cell is about 3312 x 106 kg. This is far less compared to geothermal energy source which emits about 450 gm/kWh. According to IEA (International Energy Agency), under the sustainable development policy, proposed to be adopted by the countries to mitigate CO2 emissions, nearly 54 x 109 cells are required to meet the generation target of 14139 TWh. Amongst Solar pv and geothermal energy sources, geothermal energy is the best option under this policy scenario to mitigate CO2 emissions and to control global temperature. In addition to the emissions related to the manufacturing the solar pv cells, solar panel and solar cell waste management are posing great concern to the countries. Globally the generation of solar panel waste will be of the order of 78 million tons. Countries involved in the manufacture of solar pv cells will emit considerable amount of CO2 from this source in addition to coal based thermal power pants. Solar pv cells may not emit CO2 during the generation of electricity but during its life time emissions are considerable and this source cannot be considered as “zero” emission source.