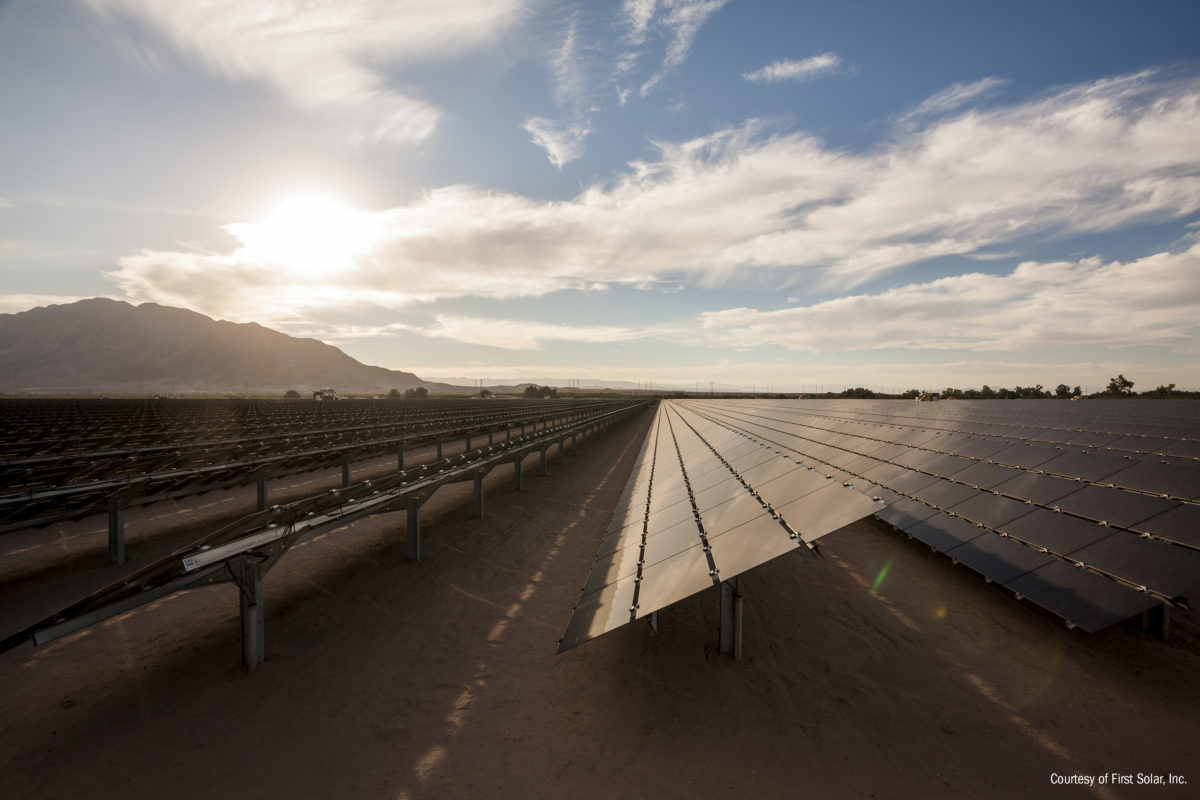
The US Department of Energy (DOE) Energy Information Administration (EIA) has released its latest Electric Power Monthly Update, which shows solar power generation up 33% in Q1 of 2018 over Q1 2017.
Solar grew to 1.8% of total electricity generation, up from 1.4% of the total in Q1 2017. But in part because Q1 covers winter months with lower levels of sunlight, all of 2017 saw solar electricity at just below 2% of all electricity. Solar thermal generation also increased by 10%, as a fraction of the total.
Wind generation was up almost 13% in the quarter, while hydroelectricity was flat.
Total fossil generation was up 6.3% year-over-year – possibly due to the early year cold snaps. However, March saw nationwide wholesale price decreases and daily peak demands dropping 3-38% with milder temperatures.
Coal use was down 8.2% to 28% of all generation, which was more than made up for by a 16% increase in natural gas electricity generation.
While the report notes March generation was down 0.1% versus March 2017, Q1 was up 4.8% over 2017. Even nuclear output, which usually is relatively static until plants go offline, increased 2.3% versus 2017.
The amount of electricity generated by solar in Q1 2018 outpaced capacity additions, suggesting higher capacity factors. Solar capacity increased only around 25% year-over-year, from just above 42 GW installed at the end of 2016, to about 53 GW installed at the end of 2017, while generation increased 33%.
In 2016, close to 10 GW of utility scale solar was installed, while about 6.2 GW was installed in 2017. Yet, total electricity generation from utility-scale solar increased by 4.5 GWh in Q1 2018 versus an increase of 3.7 GWh in Q1 2017.
There could be multiple reasons for an increase in output: dryer skies and better sunlight in the West and Southwest, more snow on the ground in the northeast or better operations and maintenance practices. However, none of those would hit so suddenly, and so hard, as the solar industry growing its ability to produce more electricity from the same capacity of solar panels with new technologies driving future pricing to unheard of numbers.

The largest factor in rising output is likely the increasing deployment of single-axis tracking. According to the above chart by Lawrence Berkeley National Laboratories, mounting panels on trackers increases output by 20% in the Southwest. This technology domination started hard in 2015, reaching 79% of new deployments in 2016.
This content is protected by copyright and may not be reused. If you want to cooperate with us and would like to reuse some of our content, please contact: editors@pv-magazine.com.


Coal use in only down by 3.6%. Not bad but not 8.2%.