The Indian solar industry continued its recording-breaking year with a cumulative 7,149 MW installed at the end of Q3 2017, according to the latest Q3 India solar market report from Mercom India Research. Solar is now the leading new energy source in India, accounting for 39% of total new power capacity additions in nine months of 2017.
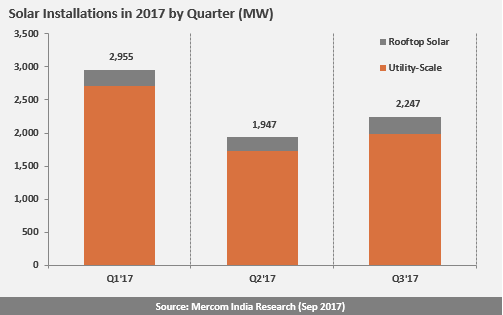
A total of 2,247 MW was installed during the period, up 300 MW from the 1,947 MW installed during Q2. Cumulative solar installations in India stood at 17 GW at the end of the third quarter.
Utility-scale and rooftop status
In the third quarter, large-scale solar projects accounted for 1,982 MW and made up 88% of installations, while rooftop installations totaled 265 MW and accounted for the remaining 12%.

Large-scale installations doubled year-over-year and rose 15% from Q2 to Q3. The pipeline of utility-scale projects currently stands at 11.5 GW, with another 5.6 GW of tenders awaiting auction.
Meanwhile, rooftop installations grew 18% quarter-over-quarter and in the first nine months of 2017, 735 MW capacity was added. Mercom forecasts that number will rise to 945 MW of new rooftop capacity for the full calendar year. As of Q3, cumulative solar rooftop installations in India totaled 1,345 MW.
Rooftop installations in India are holding back the overall rapid growth of solar in India. However, in the last 20 days, several activities were witnessed, for example, the SBI $357 million deal with World Bank, an expected ‘rent a roof’ policy from government and possible financial solutions suggested by the Climate Policy Initiative to resolve problems and promote rooftop solar in India.
Q3 witnessed low activity in tender and auctions in comparison to Q2. A total of 1,456 MW of solar were tendered and 1,232 MW of solar were auctioned in Q3 2017, down from Q2 2017 when 3,408 MW were tendered and 2,505 MW were auctioned.
“Even though the Indian solar market is on pace for a record-breaking year, the momentum has definitely slowed,” said Raj Prabhu, CEO of Mercom Capital Group. “Just like the preceding quarter, we saw many project commissioning dates get delayed and postponed to next year. In addition, there are approximately 1 GW of large-scale solar projects that are complete but unable to get connected to the grid. These factors are likely to lead to a weaker-than-projected Q4.”
Telangana – the leading state in Solar
Growth in the large-scale solar market in Q3 2017 was underpinned by more than 1 GW of combined project installations in Telangana and Karnataka, followed by more modest installation totals in Maharashtra, Uttar Pradesh, and Rajasthan. Telangana was the only state that installed more than 500 MW during the quarter. In all, eight states accounted for 96% of large scale installations during the third quarter.
With approximately 612 MW of solar installations during the period, Telangana surpassed Andhra Pradesh to become the state with the most solar installations, with a cumulative capacity of 2.5 GW installed. Telangana was closely followed by Andhra Pradesh and Rajasthan, which each boast cumulative installed capacities slightly greater than 2 GW. These three states together represent approximately 43% of the country’s total installed large-scale solar capacity.
Expected slowdown
According to the report, overall conditions in the Indian solar market became more challenging during Q3 2017 due to a 14% increase in Chinese module prices, the pending anti-dumping case, PPA renegotiations in some states, incomplete infrastructure, evacuation issues, port customs duty, and a lack of clarity surrounding the Goods and Services Taxes (GST). All of these factors led to an overall slowdown in installations and a slowdown in tenders and auctions, resulting in a reduction in the installation forecasts for 2017 and 2018.
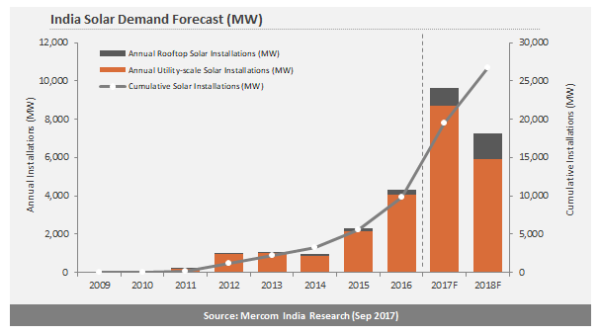
The report forecasts that total solar installations in India will range from 9.5 GW to 10 GW in the full calendar year 2017 and approximately 7 GW in 2018.
“It has become challenging to pin down an installation number as so many projects that are completed are stranded and unable to commission due to evacuation delays. It will all depend on what can get connected to the grid by the end of the year,” said Priya Sanjay, Managing Director of Mercom India.

Price uncertainty
The report also notes that the future of module prices remains uncertain, due to the initiation of an anti-dumping case against solar imports from China, Taiwan, and Malaysia. As of Q2 2017, the most recent quarter for which official government estimates were available, India imported solar modules and cells worth $1.23 billion (INR 79.4 billion). The industry expects that the Directorate General of Anti-Dumping (DGAD) will most likely recommend imposing tariffs.
Chinese average solar module prices (ASPs) in India have increased by 14% in Q3, compared to the second quarter of 2017, and range from $0.30 (INR 19.4)/W to $0.38 (INR 24.6)/W based on order size and other parameters. Therefore, module prices in the third quarter were almost 20% higher than developers's expectations. This highlights a huge gap between module price forecasts and the reality of rising prices.
“An extremely cost sensitive market like India will find it very tough to handle any aggressive imposition of tariffs. The developer community could adjust and model their bids accordingly, but we are concerned that state utilities who are already renegotiating PPAs so that they can procure solar power at the lowest possible prices will stop buying more solar if the tariff moves toward the INR 3.50 ($0.054)/kWh level,” said Prabhu. “The anti-dumping recommendation will most likely affect our future forecast,” he added.
A low tariff of INR 2.65 ($0.0413)/kWh was quoted during Q3 2017 in GUVNL’s 500 MW solar auction. Now, bidding lower than that would be difficult for developers to actualize the project, in view of the ongoing issues Indian market is facing.
Even with these challenges, solar continues to be the leading new power generation in India. Compared to solar’s share of 31.9% in the first half of 2017 of total power capacity additions, the share has increased by 7.1% at the end of the third quarter.
This content is protected by copyright and may not be reused. If you want to cooperate with us and would like to reuse some of our content, please contact: editors@pv-magazine.com.


The installed capacity seems to be on higher side, while MNRE reports say, about 15 GW cumulative installations till Sep 17, your report says, it is 17 GW, kindly clarify
Hi Bibhu Biswal,
Your doubt is valid.
Even on MNRE site, you cannot confirm it is totally correct, as the government also lacks full data.
For instance, in one of the government presentation, which I also mentioned in one of the article, it mentioned: As of August 2017, the country has installed just 1.7 GW against the 40 GW target by 2022.https://www.pv-magazine-india.com/2017/11/16/indian-government-planning-rent-a-roof-policy-for-solar-rooftop/
Considering 1.7 GW just from Rooftop + Utility-scale: 13.98 GW (as per MNRE, 30.09.2017) + off-grid: 0.53 GW (as per MNRE, 30.09.2017)= 16.21 GW, which is still not matching with the 17 GW.
Mercom is a research and consulting company and they have its own data, based on its market research. Similarly, if Bridge to India will publish data, they will show different numbers. However, there won’t be too much difference. Therefore, different media, different numbers, this is all depends on their sources. I hope I have clarified your doubt.
Regards,
Sraisth