Björn Müller and colleagues published a paper in the ISES Solar Energy Journal discussing issues around the assessment of the solar irradiation resource in the context of long-term variations often referred to as “global dimming and brightening.”
They contend that in view of long-term trends that could extend beyond the period of past observations and the projected lifetime of a solar power plant, a paradigm shift can be proposed: instead of (or maybe on top of) using the longest possible period to calculate an average value, only the 10 most recent years should be used as the estimator for future solar irradiation.
In their 2014 article, using data from the German Meteorological Service from eight observation stations across Germany with more than 40 years of Global Horizontal Irradiation (GHI), the period for the dimming period was determined to extend from the beginning of the data set 1951, to 1983, while the brightening period started in 1984 to the end of the data set in 2010.
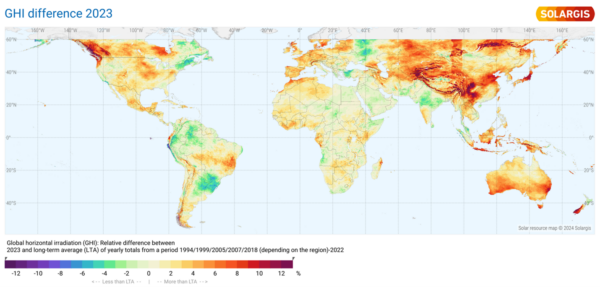
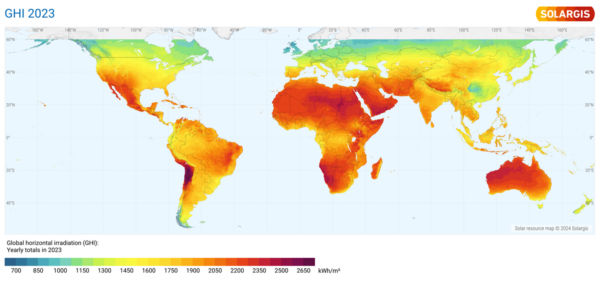
Solargis® has recently published a GHI set of solar maps showing that solar irradiation in 2023 was higher than the long-term average (LTA) of yearly totals from a period spanning from 1994 to 2022 (with different starting dates depending on the region). The maps below show (top) the % deviation in annual GHI in 2023 versus the long-term average (GHI difference 2023) and (bottom) the GHI for 2023.
Detailed regional maps, spanning different periods depending on the region are also available at the Solargis® website. GHI is the most important weather factor affecting the energy production of solar photovoltaic power plants. Having reliable and up-to-date information on GHI is critical for understanding whether a solar power plant is performing as expected or not.
Solar irradiation maps showing recent GHI values as the 2023 map can be used as a preliminary and approximate reference, and they can assist in identifying the need for running a more detailed energy assessment in case map values are not falling within the range of previously expected values, or if map values are not aligned with on-site observations and the actual energy generation, for PV plants already in operation.
In these cases, a new estimation of the expected solar resource in the long-term, including an updated monthly variability analysis, might be necessary, and a review of the on-site solar irradiance sensors plus a careful assessment of possible sources of underperformance in the PV plant might be needed.
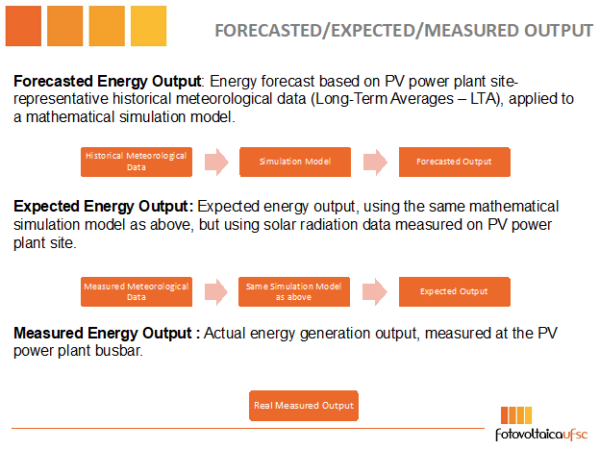
What is the difference between forecasted, expected and measured energy production?
The Energy Performance Index (EPI) of a solar power plant is a metric used to assess the overall output energy performance and efficiency of the plant. It typically represents the ratio of the actual energy output of the solar power plant to its theoretical or expected energy output under ideal conditions, considering factors such as solar radiation availability, system losses, and operational factors.
The calculation of the EPI can vary depending on the specific context and methodology used, but it generally involves comparing the actual energy production of the solar power plant over a given period (such as a month or a year) to the expected energy production based on factors such as the PV installed capacity, solar radiation levels at the site, system efficiency, and other performance parameters. The figure below illustrates the difference between forecasted, expected, and measured energy production of a solar power plant.
Popular content
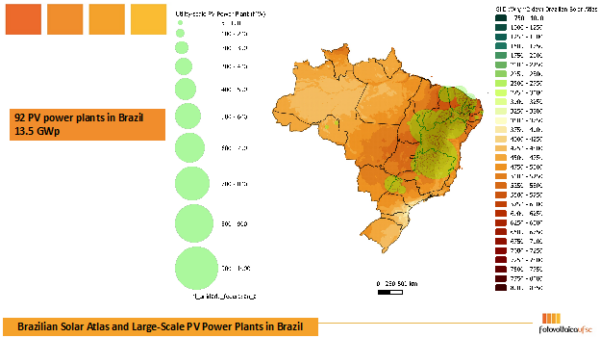
Many large-scale PV power plants around the world are underperforming due to a number of technical reasons. The EPI in many plants in the large portfolio (close to 4 GWp) evaluated by the Fotovoltaica/UFSC laboratory in Brazil is below expected performance, at levels comparable to the positive differences seen in the Solargis® maps.
The image below from the Brazilian Solar Atlas, where all the large-scale PV power plants (5 to 1000 MW) are superimposed on the solar irradiation map, shows that most of them are in the region where solar irradiation in 2023 was 4 to 8% higher than the long-term average of yearly totals from 1999 to 2022, canceling out and masking the poor performance of these assets.
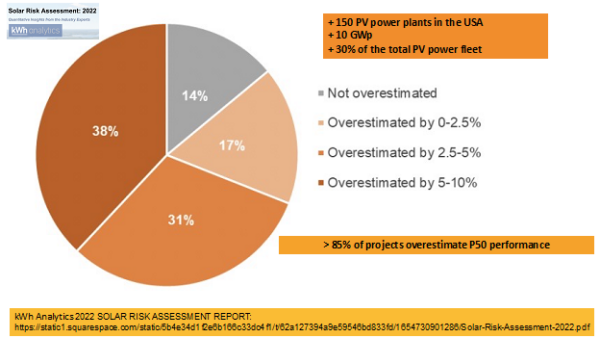
A recent Solar Risk Assessment report published by kWh Analytics shows that one in three solar assets in the USA are overstating P50 estimates by over 5%, as shown in the image below. In Australia, where for many days each year solar and wind farms are often turned off for a few hours due to negative prices, many large-scale PV plants are also underperforming, but disentangling this information is difficult.
The EPI metric is used in PV power plant monitoring, performance assessment and evaluation of contractual energy output; PV project output certification and PV power plant due diligence; PV power plant commissioning and field performance evaluation. If solar PV is to keep its reputation as a low-risk asset class with predictable and stable long-term cash flows, large-scale PV power plants must operate at high EPI levels that will have to take into account the boost in solar radiation availability as shown in 2023.
Authors: Prof. Ricardo Rüther (UFSC), Prof. Andrew Blakers /ANU
ISES, the International Solar Energy Society is a UN-accredited membership NGO founded in 1954 working towards a world with 100% renewable energy for all, used efficiently and wisely.
The views and opinions expressed in this article are the author’s own, and do not necessarily reflect those held by pv magazine.
This content is protected by copyright and may not be reused. If you want to cooperate with us and would like to reuse some of our content, please contact: editors@pv-magazine.com.

1 comment
By submitting this form you agree to pv magazine using your data for the purposes of publishing your comment.
Your personal data will only be disclosed or otherwise transmitted to third parties for the purposes of spam filtering or if this is necessary for technical maintenance of the website. Any other transfer to third parties will not take place unless this is justified on the basis of applicable data protection regulations or if pv magazine is legally obliged to do so.
You may revoke this consent at any time with effect for the future, in which case your personal data will be deleted immediately. Otherwise, your data will be deleted if pv magazine has processed your request or the purpose of data storage is fulfilled.
Further information on data privacy can be found in our Data Protection Policy.